Staff Report #2
May 8, 2017
To All Members of the Accessible Public Transit Service Advisory Committee
2016 Draft Annual Report
Recommendation
That the report be NOTED and FILED.
Background
The Draft 2016 Annual Report, as set out in Enclosure I, has been presented for Commission review and approval, subsequent to which the final Annual Report will be presented to Municipal Council via the Civic Works Committee for their review and consideration.
The 2016 Annual Report will include the Chair’s letter of submission, which is to be drafted in consultation with the Commission Chair.
The LTC Business Plan sets the direction respecting the development of LTC as an organization and the services it delivers. The Business Plan process, as depicted below serves as the basis for accountability and transparency
In the 2015-2018 Business Plan, London Transit is defined by its vision to be the valued and trusted mobility choice for Londoners. The vision is supported by the mission statement which is moving Londoners – progressively, reliably and affordably. The vision and mission are supported by five strategic outcomes:
- An integrated, affordable and valued mobility choice
- Demonstrated fiscal accountability
- Being open, transparent and understood
- Effective utilization of infrastructure
- An engaged, diverse and respectful workplace
Consistent with the Business Planning Process, each year an annual report is completed and shared publicly. The report provides an overview of how the LTC performed against each of the strategic outcomes identified in the Business Plan.
The table below sets out the performance against the outcomes for the 2016 fiscal year.
| Strategic Outcome | Grade | Comments |
| An integrated, affordable and valued mobility choice | Satisfactory | Implementation of 5 year service plan is anticipated to address the majority of service concerns relating to both service quality and levels of service provided. |
| Demonstrated fiscal accountability | Excellent | Overall effective cost management including a flat-line of both City of London investment and rider investment (fares). |
| Being open, transparent and understood | Satisfactory | Communications in all areas continues to be a work in progress. |
| Effective utilization of infrastructure | Excellent | Assets are considered to be ‘very good – fit for the future’. |
| An engaged, diverse and respectful workplace | Good | The complete re-development and implementation of training programs relating to the areas of customer service, human rights, diversity in the workplace, driver certification and health and safety in 2015 has provides a solid foundation going forward. |
The grade of ‘satisfactory’ in the area of ‘integrated, affordable and valued mobility choice’ and ‘being open, transparent and understood’, highlight the two areas of focus going forward.
With respect to ‘an integrated, affordable and valued mobility choice’, combined ridership on London’s conventional and specialized transit services increased in 2016 to 22.9 million rides, up approximately 1% over 2015 ridership levels, which was slightly lower than budget expectations. Revenue service hours were increased by a total of 24,000 hours on the services. With respect to the conventional service, the increase in hours was targeted primarily at service quality improvements versus service into new areas, and as such, the budgeted increase in ridership was limited to 1.5%. Any increase in hours on the specialized service is directly tied to increased ridership given the ongoing and unmet demand for the services.
In the 2015 Annual Report, concern was raised with respect to the decline in ridership experienced at the LTC as well as across Canada and the US. The decline in LTC ridership was for the most related to a program change with Ontario Works that saw clients issued funds directly for transportation versus the historic approach of issuing a monthly transit pass. Isolating the decline associated with the Ontario Works change from the ridership analysis indicated that conventional ridership levels in 2015 were consistent with those achieved in 2014, notwithstanding the introduction of approximately 17,500 annual service hours in 2015, indicating that, had the OW program not changed, ridership for 2015 would have flat lined, which was consistent with the experience of other transit systems in Canada and the US. The increase in conventional ridership in 2016, albeit only 1% over 2015 levels indicates that ridership in London is continuing to grow, contrary to experience elsewhere.
The objective of ‘being open, transparent and understood’, which received a ‘satisfactory’ score, will also be the focus of work programs going forward. 2016 saw the launch of the Voice of the Customer program, which provided insight into how LTC customers perceive their public transit service as well as what their priorities are for the
service going forward. This information will be utilized in 2017 as more initiatives are undertaken to address the shortfalls identified by LTC customers. 2017 will also see the launch of a re-branded LTC website and social media presence, which will provide for increased opportunity to interact with the customer base. All of these initiatives will
support the drive to ensure that future decision making includes consideration of not only the business perspective, but also the customer’s perspective, resulting in an improved customer experience.
Enclosure
I – 2016 Draft Annual Report
Recommended by:
Kelly S. Paleczny
General Manager
THE LONDON TRANSIT COMMISSION
COMMISSION – CURRENT
SHERYL ROOTH – CHAIR
DEAN SHEPPARD – VICE CHAIR
JESSE HELMER – COMMISSIONER
ERIC SOUTHERN – COMMISSIONER
PHIL SQUIRE – COMMISSIONER
SENIOR MANAGEMENT – CURRENT
KELLY PALECZNY – GENERAL MANAGER
MIKE GREGOR – DIRECTOR OF FINANCE
JOHN FORD – DIRECTOR OF TRANSPORTATION & PLANNING
CRAIG MORNEAU – DIRECTOR OF FLEET & FACILITIES
JOANNE GALLOWAY – DIRECTOR OF HUMAN RESOURCES
EXECUTIVE SUMMARY
London Transit’s vision in the 2015-2018 Business Plan is to be the valued and trusted mobility choice for Londoners. The vision is supported by the mission statement which is moving Londoners – progressively, reliably and affordably.
The vision and mission are supported by five linked and, in certain respects, competing strategic outcomes, namely:
- An integrated, affordable and valued mobility choice
- Demonstrated fiscal accountability
- Being open, transparent and understood
- Effective utilization of infrastructure
- An engaged, diverse and respectful workplace
Consistent with the Business Planning Process, each year an annual report is completed and shared publicly. The report provides an overview of how the LTC performed against each of the strategic outcomes identified in the Business Plan.
The table below sets out the performance against the outcomes for the 2016 fiscal year.
| Strategic Outcome | Grade | Comments |
| An integrated, affordable and valued mobility choice | Satisfactory | Implementation of 5 year service plan is anticipated to address the majority of service concerns relating to both service quality and levels of service provided. |
| Demonstrated fiscal accountability | Excellent | Overall effective cost management including a flat-line of both City of London investment and rider investment (fares). |
| Being open, transparent and understood | Satisfactory | Communications in all areas continues to be a work in progress. |
| Effective utilization of infrastructure | Excellent | Assets are considered to be ‘very good – fit for the future’. |
| An engaged, diverse and respectful workplace | Good | The complete re-development and implementation of training programs relating to the areas of customer service, human rights, diversity in the workplace, driver certification and health and safety in 2015 has provides a solid foundation going forward. |
The grade of ‘satisfactory’ in the area of ‘integrated, affordable and valued mobility choice’ and ‘being open, transparent and understood’, highlight the two areas of focus going forward.
With respect to ‘an integrated, affordable and valued mobility choice’, combined ridership on London’s conventional and specialized transit services increased in 2016 to 22.9 million rides, up approximately 1% over 2015 ridership levels, which was slightly lower than budget expectations. Revenue service hours were increased by a total of 24,000 hours on the services. With respect to the conventional service, the increase in hours was targeted primarily at service quality improvements versus service into new areas, and as such, the budgeted increase in ridership was limited to 1.5%. Any increase in hours on the specialized service is directly tied to increased ridership given the ongoing and unmet demand for the services.
In the 2015 Annual Report, concern was raised with respect to the decline in ridership experienced at the LTC as well as across Canada and the US. The decline in LTC ridership was for the most related to a program change with Ontario Works that saw clients issued funds directly for transportation versus the historic approach of issuing a monthly transit pass. Isolating the decline associated with the Ontario Works change from the ridership analysis indicated that conventional ridership levels in 2015 were consistent with those achieved in 2014, notwithstanding the introduction of approximately 17,500 annual service hours in 2015, indicating that, had the OW program not changed, ridership for 2015 would have flatlined, which was consistent with the experience of other transit systems in Canada and the US. The increase in conventional ridership in 2016, albeit only 1% over 2015 levels indicates that ridership in London is continuing to grow, contrary to experience elsewhere.
The objective of ‘being open, transparent and understood’, which received a ‘satisfactory’ score, will also be the focus of work programs going forward. 2016 saw the launch of the Voice of the Customer program, which provided insight into how LTC customers perceive their public transit service as well as what their priorities are for the service going forward. This information will be utilized in 2017 as more initiatives are undertaken to address the shortfalls identified by LTC customers. 2017 will also see the launch of a re-branded LTC website and social media presence, which will provide for increased opportunity to interact with the customer base. All of these initiatives will support the drive to ensure that future decision making includes consideration of not only the business perspective, but also the customer’s perspective, resulting in an improved customer experience.
The recognition/confirmation by both senior levels of government of the important role an effective and efficient public transit service plays in the overall sustainability of a municipality’s transportation system in 2016 has, and will continue to be critical going forward. The planned increases in Provincial Gas Tax for Transit allocations over the next three years, growing from 2 cents per litre to 4 cents per litre will provide for the much needed ongoing operating investment to allow LTC to continue to increase service hours, making the system more attractive to Londoners. The Federal government announcement of the Public Transit Infrastructure Funding program included a Phase I that will provide funding relating to infrastructure renewal, and Phase II funding is anticipated to be utilized to fund, in part, the capital costs associated with building London’s rapid transit corridors and related passenger amenities.
AN INTEGRATED, AFFORDABLE AND VALUED MOBILITY CHOICE
The strategic objective calls for the continued development and delivery of accessible public transit services that are integrated with other modes of transportation, dynamic in nature and considered a valued investment to all stakeholders. The following table sets out an assessment of the 2016 performance against key elements of this strategy.
| Key Elements | Grade |
| Reviewing the transit service to ensure it meets the needs of a growing, competing and changing market (includes service design, routing, frequency and accessibility) |
Excellent |
| Delivering the service consistent with defined schedules and standards |
Satisfactory |
| Developing and implementing proven technology in support of an effective, efficient and evolving transit service |
Good |
| Progressing in the development and delivery of integrated, accessible public transit services |
Needs Improvement |
Conventional Transit Services
As noted in the following chart which compares actual 2016 ridership and related measures to 2016 budget, expectations were consistent with budget targets in all three key efficiency measures.
2016 Ridership Performance Actual vs. Budget
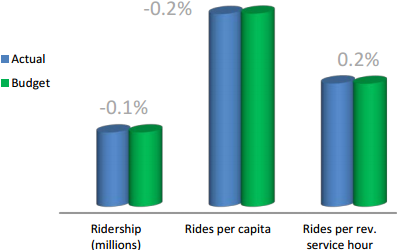
The ‘rides per revenue service hour’2 measure can be viewed from two perspectives, in that the higher it is, the more efficiently the service is operating (i.e. buses are full), and the lower it is, the more quality the service is from a customer perspective, in that the buses will be less crowded and customers will, more often, be able to get a seat. This measure is one that requires a delicate balance in order to ensure efficiency and offer quality at the same time.
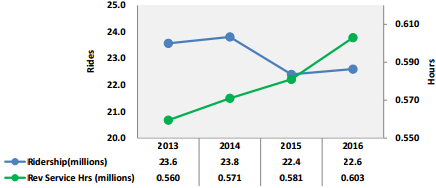
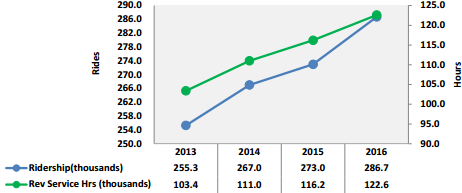
The ridership and service hour performance over the period of 2013-2016 is set out in the following chart. Over the period of 2012-2014, ridership growth was occurring at an average rate of approximately 1.9% per year, but declined by 5.9% in 2015, and then grew by approximately 1% in 2016. Conversely, service hours over the period have increased by an average rate of approximately 1.5% per year. As indicated earlier in the report, the positive for 2016 with respect to these measures, is that ridership has again grown over 2015 levels, and the ongoing increases in service hours has had positive impacts on service quality issues including overcrowding.
Conventional Ridership and Service Hours
Conventional Service Performance Indicators
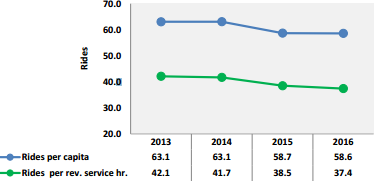
1Rides per capita: total rides divided by population – provides for comparison of ridership levels across municipalities of varying populations
2Rides per revenue service hour: total rides divided by total hours vehicles are providing service – measures the efficiency of the system
As noted in the above charts, ‘rides per capita’1, and ‘rides per revenue service hour’2 have declined marginally over the period. In terms of ‘rides per capita’, the slight increase in 2016 is indicative of the ridership increase over 2015.
The hours of service added beginning in 2014 have been significantly higher than those added over the last number of years (approximately 17,500 annual service hours versus 6,000 historically). This level of service hour enhancement is planned to continue through to 2019 as the Commission’s 5 Year Service Plan is implemented. In addition to the new hours being added each year, significant re-allocation of hours is also included in the Plan, with the end result being a service that is ‘right sized’, providing service levels and frequencies consistent with rider demand across the City.
The increased hours included in the 5 Year Service Plan are targeted more to address service quality issues and ridership retention versus ridership growth, however a marginal 1.5% ridership growth rate is anticipated to occur each year. As indicated earlier, ridership in 2016 increased by 1% over 2015 levels.
London Transit measures service performance by comparison to a peer group of Ontario transit systems (with bus operations only, with populations greater than 100,000). The following table sets out a comparison of 2015 key service performance indicators for LTC versus the identified Ontario group average. The 2016 data for LTC is also shown, noting the 2016 group data will not be published until the fall of 2017. The comparison information is compiled and published by the Canadian Urban Transit Association (CUTA).
Conventional Transit Services – Summary Performance Comparison
| Description Service Performance |
2015 Peer Average | 2015 LTC | Ranking | 2016 LTC |
| Ridership (millions) | 11.8 | 22.4 | 2nd | 22.6 |
| Rides per capita | 33.1 | 58.7 | 2nd | 58.7 |
| Rides per service hour | 23.4 | 38.5 | 1st | 37.4 |
| Service hours per capita | 1.4 | 1.5 | 7th | 1.5 |
| Service area population | 7th |
Note: Peer group includes 16 Ontario transit systems in municipalities with a population greater than 100,000. (York Region, Mississauga, Durham Region, Brampton, Hamilton, Waterloo Region, London, Windsor, Oakville, Burlington, St. Catharines, Sudbury, Barrie, Guelph, Thunder Bay and Kingston).
As noted, while 7th in terms of population, ‘rides per capita’ and ‘rides per service hour’ ranks London second and first respectively overall in comparison to the peer group. While the overall rankings place London high in comparison to the peer group, there needs to be a balance between “service efficiency” and “service quality” measures.
London’s historic and current ridership growth to service growth ratio has helped keep London in the lead when compared to its peer group. As indicated in the table, London’s 2016 performance continues to be well ahead of the peer group average.
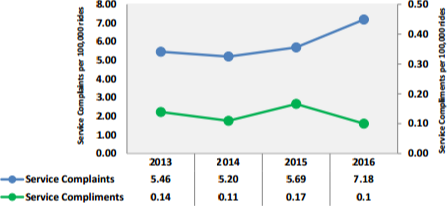
Service quality is also measured through feedback from the customer, which, beginning in 2016, includes the addition of the feedback received through the Voice of Customer surveys. Historically customer contacts were relied upon as the only measure of customer satisfaction. Given that customers of any service are far more likely to contact the provider with a complaint when they have had a poor experience versus calling to provide a compliment when they have had a good experience, data from contacts has primarily been relied upon to provide insight into the areas of service delivery that customers were not satisfied with.
The following chart illustrates that service performance complaints have remained consistent over the period of 2013 through 2014 and began increasing in 2015 and 2016. The increase in service complaints in 2016 are tied directly to the significant amount of changes made in September in the rollout of the 2016 service plan. While communication relating to the changes began in July, many customers were not prepared for the changes, which resulted in a significant increase in complaints.
Customer Contacts – Service Performance
The other major area of analysis regarding service quality is Operator performance, which is assessed in terms of both complaints and compliments. Performance results for 2013 to 2016 are set out in the following chart.
Customer Contacts – Operator Performance
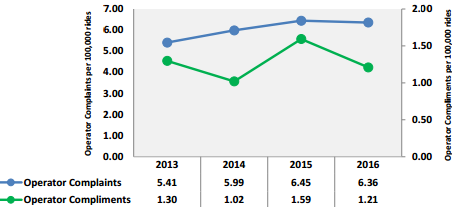
The number of complaints regarding Operator performance had trended upward since 2013 (in terms of absolute numbers and when expressed as complaints per 100,000 riders), however declined slightly in 2016. The improvement in this trend is significant given the service changes implemented in September of 2016 and the related customer frustration faced by operators with customers that were not prepared. In addition, 201 operators participated in an enhanced education program targeted at providing additional guidance and support to Operators on how best to effectively manage issues such as schedule adherence and overcrowding, while emphasizing appropriate driver behavior and re-iterating professional customer service expectations.
The chart below sets out the responses from LTC customers who participated in the Voice of Customer surveys conducted in June and November of 2016. In each case, the measure indicates the percentage of customers who indicated they ‘agreed’ or ‘strongly agreed’ with the statement.
Voice of the Customer – Satisfaction with Conventional Service Aspects
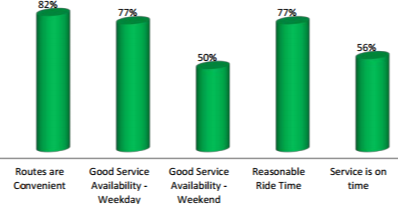
The two areas of concern highlighted by customers are service availability on the weekends and on-time reliability of the service, both of which were also highlighted by customers who participated in the surveys feeding into the 5 Year Service Plan, in which many of the planned service changes deal with matching service levels to ridership demands (on time reliability via reduced overcrowding) and weekend service improvements.
Voice of the Customer also gathered data specific to the perceived Operator performance, which is set out in the graph below, noting the measures indicate the percentage of customers who indicated they ‘agreed’ or ‘strongly agreed’ with the statement.
Voice of the Customer – Satisfaction with Operator Performance
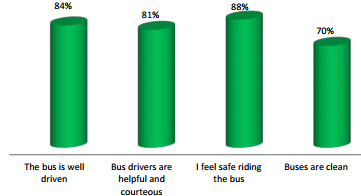
The data gathered from the Voice of the Customer surveys supports the commentary made earlier with respect to Operators performing well while in service notwithstanding the significant service changes that were implemented in September 2016.
Specialized Transit Services
The following table provides a comparison of ridership and service hours actual to budget performance for 2016. As noted, ridership results and actual service hours provided fell short of targets. The ridership shortfall was directly related to availability of vehicles required to implement the planned service improvements due to longer than anticipated delivery times for new vehicles.
2016 Ridership and Service Hours Actual to Budget Performance
| Description | Actual | Budget | Amount Better (Worse) | Percent Better (Worse) |
| Eligible passenger trips | 259,200 | 287,600 | (28,400) | (9.9)% |
| Attendant trips | 27,500 | 33,100 | (5,600) | (16.9)% |
| Total ridership | 286,700 | 320,700 | (34,000) | (10.6)% |
| Service hours | 122,700 | 131,000 | (8,300) | (6.4)% |
| Registrants | 7,859 | 7,700 | 259 | 3.4% |
| Eligible passenger trips/registrant | 34.6 | 37.4 | (2.7) | (7.2)% |
| Non-accommodated trips/registrant | 1.6 | 1.1 | (0.5) | (45.2)% |
Non-accommodated trip – trip request that cannot be accommodated within 30 min of requested pick up time
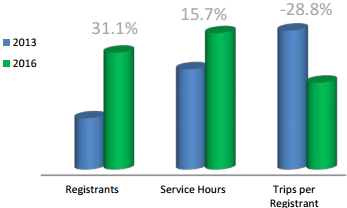
The specialized transit service has also experienced an imbalance in registrant growth over service hour growth since 2013. As noted in the following chart, the ratio of registrant growth to service growth is approximately 2 to 1.
Registrant to Service Hour Growth 2013 vs. 2016
Ridership levels are more closely tied to service levels on the specialized services given the capacity limitations on the vehicles (i.e. maximum 6 mobility devices and 10 seated passengers, no standees), and as such the relationship between the two is linear. The move to larger vehicles in 2014 (max capacity 16 vs. historic 10), affords the opportunity to provide a greater number of trips within the same hours, increasing overall service efficiency.
The following charts set out a comparison of ‘total ridership’, ‘service hours’ and the corresponding relationship of ‘trips per registrant’ and ‘non-accommodated trips per registrant’ for 2013 to 2016. The steady decline in total trips per registrant over the period is tied to the steady growth in registrants that is anticipated to continue.
Specialized Ridership and Service Hours
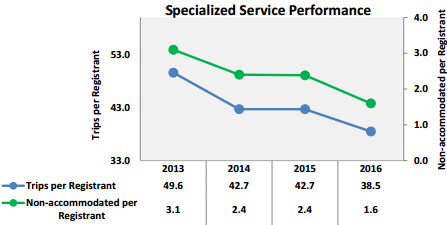
A positive trend in 2016 relates to the decline in the non-accommodated rates per registrant, which indicates that more trips requests were able to be accommodated.
As referenced in the table below, service complaints have remained somewhat consistent over the period of 2013 to 2016 (in both absolute numbers and on a per 10,000 eligible passenger trips basis). In the area of customer service, the most common complaints include operator conduct, lack of service availability and issues with the booking line. The rise in customer service complaints in 2015 and 2016 is primarily associated with the growing registrant base and the frustration with the current booking lines. A new scheduling and telephone system was implemented in April 2017, which is anticipated to alleviate the concerns related to the booking line. The Operator conduct issues are referred to the service provider for follow-up and appropriate action.
Specialized Transit Service Performance – Complaints/Compliments 2013-2016
| Description | 2013 | 2014 | 2015 | 2016 |
| Customer Service | 92 | 81 | 143 | 221 |
| Service Performance | 26 | 34 | 39 | 32 |
| Total complaints | 118 | 115 | 182 | 253 |
| Complaints per 100,000 riders | 46.2 | 43.1 | 66.9 | 78.1 |
| Percent change year over year | (6.9)% | 55.4% | 16.8% | |
| Compliments | 20 | 28 | 19 | 29 |
| Compliments per 100,000 riders | 7.8 | 10.5 | 7.0 | 10.2 |
| Percent change year over year | 34.6% | (33.3)% | 45.7% |
As with conventional transit, specialized transit performance results are assessed from a service perspective in comparison to all other Ontario specialized transit systems. The following table sets out a comparison of key service performance indicators for LTC in 2015 versus the identified Ontario group average, as well as 2016 performance for LTC.
Specialized Transit Services – Summary Performance Comparison
| Description | 2015 Ontario Avg. | 2015 LTC | 2016 LTC |
| Service Performance | |||
| Service hours per capita | 0.2 | 0.3 | 0.3 |
| Total trips per capita | 0.67 | 0.72 | 0.74 |
| Total trips per service hour | 2.7 | 2.4 | 2.4 |
| Percent eligible passenger trips | 92.2% | 89.9% | 90.4% |
| Trips per eligible registrant | 49.5 | 41.4 | 38.4 |
Service performance indicators are, for the most part, consistent with the Ontario average, with the exception being trips taken per eligible registrant. London’s performance is at 85% of the group average.
DEMONSTRATED FISCAL ACCOUNTABILITY
The strategy calls for prudent fiscal and operational management, supporting sustainability, competitive positioning, affordability and valued return on investment. The investment return includes social, economic and environmental returns. The following table sets out an assessment of 2016 performance against key elements of this strategy.
| Key Elements | Grade |
| Providing a high quality and economically sustainable transportation service | Satisfactory |
| Ensuring decisions regarding investment (operating and capital) are evidenced-based, and are consistent with the goals and objectives of the organization and services | Excellent |
| Establishing a sustainable financial strategy, one that reflects the unique dynamics (characteristics) of each investment source | Excellent |
| Fostering an environment of continuous improvement that is, doing the right things at the right time in the most effective and efficient manner | Excellent |
| Optimizing investment and utilization of existing and new technologies supporting the effective and efficient delivery and management of the service | Good |
2016 Operating Budget Program
The 2016 operating budget program for conventional and specialized transit services totalled approximately $69.145 million with a break-even operating performance.
The major factors contributing to the break even budget performance included:
- unfavourable revenue performance relating to:
- lower than expected ridership and related revenue
- lower than budgeted Provincial Gas Tax contributions which were offset by favourable expenditure performance relating to:
- lower than expected fuel costs (price-related)
- lower than expected personnel costs primarily related to reduced tripper hours, and delays in hiring replacement staff associated with retirements and terminations
As noted in the following chart, the actual source of 2016 operating investment varied only slightly from budget. City investment levels have, for the most part, been flat-lined over the course of the last four years, given the economic climate and related constraints on public investment.
2016 Operating Budget Source of Investment
Conventional and Specialized Transit Systems
| Description | 2016 Actual | 2016 Budget |
| Transportation revenue | 46.0% | 46.6% |
| Operating revenue and reserve transfers | 3.5% | 3.1% |
| Provincial gas tax | 9.6% | 9.7% |
| City of London | 40.9% | 40.6% |
| 100.0% | 100.0% |
Financial performance is compared to the Commission’s peer group in the same manner as service performance for the respective services. In terms of conventional services in comparison to the peer group, London’s performance is at or near the top in all key financial performance indicators, as noted in the following table.
Conventional Transit Services – Summary Performance Comparison
| Description Service Performance |
2015 Peer Average | 2015 LTC | Ranking Out of 16 | 2016 LTC |
| Financial Performance | ||||
| Operating cost per ride | $5.10 | 16th (lowest) | ||
| Municipal cost per ride | $2.64 | 16th (lowest) | ||
| Total Operating Cost Sharing | ||||
| Municipality | 53.0% | 39.5% | 16th (lowest) | 37.8% |
| Passenger & Operating | 39.5% | 53.5% | 1st (highest) | 53.6% |
| Provincial gas tax | 7.5% | 7.2% | 7th | 8.6% |
Note: Peer group includes 16 Ontario transit systems in municipalities with a population greater than 100,000. (York Region, Mississauga, Durham Region, Brampton, Hamilton, Waterloo Region, London, Windsor, Oakville, Burlington, St. Catharines, Sudbury, Barrie, Guelph, Thunder Bay and Kingston).
As noted, LTC’s municipal operating investment is well below the peer group average, ranked 16th (last) of the 16 transit systems comprising the peer group. Consistent with the peer group comparison of service efficiency measures, financial performance measures must also maintain an appropriate balance. In order for the transit service in London to grow to meet the expectations of the public at large and those set out in the 2030 Transportation Master Plan (TMP), the municipality will need to increase the level of investment to be consistent with other jurisdictions.
When increased investment is viewed in light of the operating cost per trip measure, what becomes evident is that the return on the investment from the City’s perspective is significantly higher than that being experienced by other jurisdictions. London Transit continues to be a very good investment and with growth investment will continue to increase the economic, environmental and social returns to the City and its residents.
The same favourable financial performance applies to specialized transit services, as indicated in the following table, noting for both services, the operating and municipal costs per trip are significantly lower than the peer group average. As with conventional transit, municipal investment in specialized transit is also well below the Ontario average.
Specialized Transit Services – Summary Performance Comparison
Ontario Specialized Systems
| Description Service Performance | 2015 Peer Average | 2015 LTC | 2016 LTC |
| Financial Performance | |||
| Operating cost per ride | $32.19 | $21.18 | $21.52 |
| Municipal cost per ride | $29.51 | $14.93 | $16.31 |
| Total Operating Cost Sharing | |||
| Municipality | 90.1% | 72.2% | 73.1% |
| Passenger & Operating | 7.0% | 8.8% | 7.9% |
| Provincial gas tax | 2.9% | 19.1% | 19.0% |
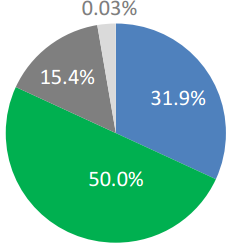
2016 Percent Share of Source Investment
Conventional and Specialized Transit Services
Conventional Transit Service

Operating cost per ride $2.78
Municipal investment per ride $1.05
Specialized Transit Service
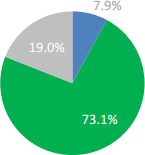
Operating cost per ride $21.52
Municipal investment per ride $16.31
• Passenger & Operating • Municipality • Provincial gas tax
2016 Capital Budget Program
The 2016 capital investment program totalled approximately $9.7 million, of which 93% applied to three key projects. Two of the four programs were completed. The other two are multi-year projects. The four projects include:
- bus replacement: a $8.1 million project providing replacements for 12 buses was completed in 2016. The bus replacement program is critical to supporting fleet reliability and lowering fleet maintenance costs by moving to an average fleet age of six years.
- bus expansion: a $0.6 million project completed in 2016 provided for the expansion of the fleet by one bus.
- Information systems software and hardware program: a $0.4 million project consisted of a number of initiatives which are considered on-going in nature including the upgrade of the specialized transit system scheduling software and telephone system and the implementation of networking hardware and servers to upgrade the overall network infrastructure consistent with the Technology Plan.
All of the capital programs operated within budget. Capital investment in 2016 was shared as follows.
Capital Program Investment Share
■ Provincial gas tax
■ City of London
■ Federal gas tax
■ LTC reserves
BEING OPEN, TRANSPARENT AND UNDERSTOOD
The strategy calls for all stakeholder communications to be conducted in an open, transparent, timely and inclusive manner supporting common knowledge and understanding. The following table sets out an assessment of 2016 performance against key elements of this strategy.
| Key Elements | Grade |
| Developing informed relationships with all stakeholders both internal and external to LTC | Good |
| Employing a consistent communication brand supporting clear, concise and timely communication | Satisfactory |
| Investing in and effectively utilizing a variety of communication forms and technology to build and sustain informed relationships | Satisfactory |
| Building a respectful working relationship with local and national media | Good |
As indicated earlier in the report, the launch of the Voice of the Customer program in 2016 has provided valuable insight into the LTC’s customers view and perspectives of their public transit system. The following graphs illustrate LTC customer responses relating to their perception of availability of information and responses provided through customer service representatives, noting the measures indicate the percentage of customers who indicated they ‘agreed’ or ‘strongly agreed’ with the statement.
Voice of the Customer – Availability of Information
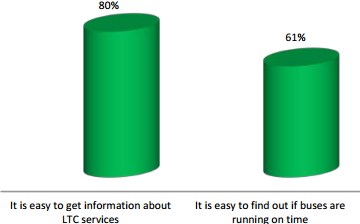
As the table indicates, 80% of LTC customers surveyed believe it is easy to find information about LTC services. This high level of satisfaction may be influenced by the fact that they are current riders, and they have made themselves aware of where to find the required information. The planned redesign of the LTC website and launch of corporate social media platforms in 2017 is anticipated to enhance the ability for both riders and the non-riders to find information about LTC services.
Voice of the Customer – Customer Service Received
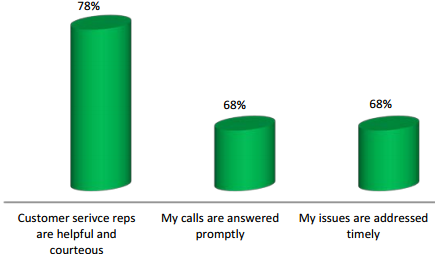
The responses illustrated in the above indicate that while LTC customers have a high level of satisfaction when they have made contact with a customer service representative, they are somewhat less satisfied with their ability to get through on the customer service line, or have their issue addressed in a timely manner. In 2016, a review of the customer contact system and related correspondence with customers was reviewed with the intent of identifying ways in which to speed up the process of responding to customer inquiries and complaints, noting in some cases, given the nature of the complaint, investigations are required which take time. The review was completed in 2016 and recommendations will be implemented in 2nd quarter of 2017 which are anticipated to improve the customer experience when contacting the LTC.
2016 also saw an enhanced role for LTC administration in public meetings with respect to the Shift rapid transit project. The establishment of the Rapid Transit Implementation Working Group, which includes members of Municipal Council and the Commission, has provided the opportunity to ensure that LTC information and perspectives are included in decisions going forward relating to the rapid transit project. Participation at public meetings has provided the opportunity to ensure the public is provided with accurate information regarding the LTC. While progress was made in 2016, significant efforts continue to be required in all areas of communication going forward.
EFFECTIVE UTILIZATION OF INFRASTRUCTURE
The strategy calls for acquisition and maintenance of required infrastructure supporting service reliability, noting infrastructure includes fleet, facility, technology and other fixed assets. The following table sets out an assessment of 2016 performance against key elements of this strategy.
| Key Elements | Grade |
| Linking asset planning and service planning | Excellent |
| Effectively utilizing proven technology to meet business/service needs (e.g. smart bus technology to assist with the delivery of quality customer service) | Good |
| Completing evidence based assessments on the acquisition and maintenance of critical infrastructure | Excellent |
| Continuous review and improvement of systems, processes and procedures supporting effective use of all assets | Excellent |
The reliable accessible infrastructure strategy addresses the maintenance, retention, and acquisition of equipment, facilities, and fleet. Specific programs and policy direction associated with the strategy are reflected in the Commission’s Asset Management Plan. The programs’ investment totals $179.2 million, $109.6 million of which is in rolling stock. The following table sets out the assessment of LTC Assets included in the Asset Management Plan.
| Assets | Grade |
| Facility – 450 Highbury | Very good – fit for the future |
| Facility – 3508 Wonderland | Very good – fit for the future |
| Rolling stock | Very good – fit for the future |
| Shelters, stops and pads | Good – adequate for now |
| Fare and data collection systems | Good – adequate for now |
| AVL/radio system (smart bus) | Very good – fit for the future |
| Shop equipment and tools | Very good – fit for the future |
| Smart card system | Very good – fit for the future |
| All other infrastructure | Very good – fit for the future |
The assigned assessment ratings were assessed on infrastructure needs associated with maintaining current service levels and an ongoing commitment to investing, as a priority, in a state of good repair both in terms of capital investment and maintaining and development of pro-active preventative maintenance programs for buses including ancillary system versus reactive and establishing full service agreements covering both maintenance and upgrades for technology (system) based infrastructure. Strict adherence to the strategy over the past 10 years has resulted in the elimination of the infrastructure deficit. With the exception of ‘shelters, stops and pads’ and the ‘fare and data collection system’, the LTC’s assets are assessed as being “very good – fit for the future” which is the highest rating ssignable. Both of these programs are included in the 2016-2024 Capital Budget program.
The announcement of the Public Transit Infrastructure Funding program by the Federal government in 2016 provided the opportunity to review existing and future infrastructure needs and address them in a more timely manner than had been planned. In March 2017, confirmation was received from the Federal government of their commitment to 50% funding on a number of infrastructure projects totaling $25 million, that will result in improved infrastructure, setting the foundation to grow the service as anticipated in the Commission’s Post 2019 Service
Framework and the City of London’s Rapid Transit plan. Completion of the projects would not be possible without the funding received annually through the Provincial Gas Tax for Transit Program, which for the most part, will fund the remaining 50% of the identified projects.
AN ENGAGED, DIVERSE AND RESPECTFUL WORKPLACE
The strategy calls for the development of a results-oriented organization attracting, developing and retaining exceptional individuals creating an engaged, diverse and respectful workplace. The following table sets out an assessment of 2016 performance against key elements of this strategy.
| Key Elements | Grade |
| Developing a culture that is inclusive, collaborative, respects individual dignity, promotes accountability and open communication | Good |
| Developing a learning organization supporting employees being successful in their roles, that recognizes performance and develops human resource capacity to ensure business continuity | Good |
| Developing a qualified and diverse work force, reflective of community demographics | Good |
| Creating a safe work environment and encouraging employee health and wellness | Good |
| Effectively using technology to support employees in their roles | Good |
The overall rating of the strategy is defined as good, noting 2016 saw:
- the continued roll out of upgraded training programs (driver certification, diversity, human rights, customer service, and others) for all front line operations employees
- participation of London Transit’s Diversity Committee in community outreach programs such as London’s Community Forum on Racism, Making your Agency a Positive Space, and the London and Area Works Job Fair
- continued development of performance-based management
- expanded outreach for future LTC employees through participation in a number of local job fairs
- ongoing review and change to the organization’s structure, reflecting the performance review management program principle of ensuring the most efficient and effective use of resources
The planning and development of the organization is considered an ongoing initiative. Prior to being filled, vacant positions are reviewed and assessed to ensure the resources are required and/or whether there is opportunity to re-invest the resources elsewhere in the organization where they be more needed.
LOOKING FORWARD – TRANSFORMATIONAL INITIATIVES
Over the next few years, a number of key initiatives will be completed/undertaken that will be pivotal in moving toward the changes that are required in order for London’s public transit services to be as effective and efficient as possible, while meeting the demands of current and future transit customers. The following provides a brief overview of what are considered the key initiatives that LTC will play a role in and/or lead going forward.
Rapid Transit Project – Shift
Municipal Council is scheduled to approve the final routing configurations for the rapid transit project in the spring of 2017, subsequent to which the next phase of the EA will begin (detailed corridor design). Final approval of the Rapid Transit Master Plan will provide the required details to ensure that the LTC Post-2019 plans align with the rapid transit corridors. The Post- 2019 Service Framework will be a key input into the next LTC Business Plan and corresponding Financial Plan and multi-year budget.
The creation of the Rapid Transit Implementation Working Group has provided the opportunity for members of the Commission to work with members of Municipal Council on moving the rapid transit project forward, ensuring a collaborative and coordinated approach between the City of London and the LTC.
Implementation of 5 Year Service Plan (2015-2019)
In the spring of 2015, the Commission adopted a 5 Year Service Plan which resulted from a comprehensive route structure and service guidelines review. The underlying intent of the 5 Year Service Plan is to ‘right size’ the service through the addition of approximately 17,500 hours per year as well as the reallocation of service from under-utilized routes/areas of the city to areas where current service levels do not match ridership demand. The outcomes associated with the implementation of the 5 Year Service Plan include:
- Addressing overcrowding and missed trips
- Simplifying the network
- Continuing to build on the express routes
- Addressing underperforming routes and route segments
- Improving weekend and late evening service
- Providing direct connections between major origins and destinations
- Minimizing impacts on existing passengers
- Enhancing overall service levels with a focus on a frequent transit network and strategic corridors
Specialized Transit Scheduling/Dispatching System
The replacement of the scheduling/dispatching system for specialized service began in April 2017, and is scheduled to be rolled out in phases through the fall of 2017. The new system will not only address current system shortfalls elating to schedule optimization and ease of trip assignments, but will also address a number of long-standing customer concerns relating to the booking lines and the requirement for customers to redial multiple times in order to get through to a call taker. The new system will also be integrated with the conventional transit routes, and enable the call takers to book trips that utilize both the specialized and conventional services for parts of a trip where the opportunity exists. This feature is considered a key requirement in order to begin to address the work program initiative relating to the integration of the conventional and specialized services.
Smart Card System
The smart card system is a technology-based fare payment system that will transform, with the exception of cash fares, LTC’s fare policies, programs and processes. The system, once fully implemented will replace existing ticket and pass media programs with reloadable smart cards having the same characteristics.
The system was plagued with ongoing issues throughout 2016 relating to the online revaluing of the smart card media. It is anticipated these issues will be addressed in the spring of 2017, providing the opportunity to proceed with the implementation of the stored-value aspect of the system.
Website Update and Social Media Presence
2017 will see the launch of a rebranded LTC corporate website as well as the establishment of a corporate social media presence. This work is directly related to the objective of enhancing the customer experience as it relates to the use of London’s public transit services. Providing multiple avenues for customers to communicate with LTC will provide for a better understanding of what is important to LTC customers, which will be a key consideration in business decisions made going forward.