Staff Report #1
March 10, 2020
To All Members of the Accessible Public Transit Service Advisory Committee
Re: 2019 Conventional Transit Service Performance Report
Recommendation
That the report be NOTED and FILED.
Background
The 2019-2022 Business Plan, London Transit’s vision is: “The valued and trusted mobility choice for Londoners”. The vision is supported by the mission statement, “Moving Londoners – progressively, reliably and affordably”. The vision and mission statements give direction to five congruent and competing strategic outcomes, namely:
- An integrated, affordable and valued mobility choice
- An engaged, diverse and respectful workplace
- Demonstrated fiscal accountability
- Being open, transparent and understood
- Effective utilization of infrastructure
Service performance is measured in terms of fiscal accountability (efficiency), service (effectiveness and quality), and communication (accuracy and quality of information provided).
Conventional Transit Service – Efficiency
The following table provides a summary of ridership and revenue service hours actual to budget performance for 2019 (unaudited). Actual ridership and service provided, as well as the related measures were consistent with budget expectations.
2019 Ridership and Service Hours – Actual versus Budget
| Description | Actual | Budget | Percent Better (Worse) |
| Revenue service hours (millions) | 0.65 | 0.66 | (1.5%) |
| Ridership (millions) | 24.6 | 24.2 | 1.7% |
| Rides per capita | 60.1 | 59.1 | 1.7% |
| Rides per revenue service hour | 37.8 | 36.6 | 3.3% |
| Service hours per capita | 1.6 | 1.6 | — |
The following table provides comparisons in the various ridership and service hour measures over the past four years.
Ridership and Service Hour Comparisons – 2016 through 2019
| Description | 2016 | 2017 | 2018 | 2019 | % Change over Period |
| Revenue service hours (millions) | 0.603 | 0.614 | 0.635 | 0.656 | 8.8 % |
| Ridership (millions) | 22.564 | 22.918 | 23.746 | 24.600 | 9.0 % |
| Rides per capita | 59.2 | 60.1 | 60.7 | 60.1 | 1.5 % |
| Rides per revenue service hour | 38.5 | 37.3 | 37.4 | 37.8 | (1.8)% |
| Service hours per capita | 1.6 | 1.6 | 1.7 | 1.6 | — |
As indicated in the table above, there have been improvements in all measures over the four-year period 2016 through 2019, much of which is the result of the implementation of the service improvements in each of the years as part of the Five Year Service Plan.
The 2019 construction season that ran from late March through December, and as was the case in 2018, was one of the most extensive, in terms of impacts to LTC services in recent years. During the majority of the construction season, LTC had 11 routes navigating through construction zones, especially through the core, all of which had a significant impact on the on-time reliability of the service. In addition, the extent of some of the construction projects resulted in the need to close bus stops, which resulted in transit riders having to walk further to get to the nearest stop. Communication efforts during this period were significantly enhanced, with a focus on providing up-to-date information on service delays and detours as well as stop-level notifications along affected routes. The introduction of time-stamped tweets in 2018, which provide up-to-date service information at key times during the morning and afternoon peak periods was well received by LTC followers and as a result continued throughout the 2019 construction season. LTC administration attended regular meetings with civic administration and construction contractors to ensure the most up-to-date information could be shared with transit customers. As set out in the Commission’s Staff Report #5 – 2019-2020 Road Construction Update, dated January 29, 2020, this approach will be followed again in 2020 as the construction season is set to result in disruptions to a number of routes and transit service in general.
Voice of the Customer
As indicated in the Commission’s Staff Report #3, Voice of the Customer, dated October 30, 2019, London Transit has been conducting annual Voice of the Customer Surveys since 2016. At the October 30, 2019 meeting, the Commission approved deferring the 2019 survey to 2020 subsequent to a review of the program. Given this deferral, the 2018 survey results will be utilized in this report as the most current data still representative of passenger perceptions.
Impressions of London Transit Service
This area of the Voice of the Customer survey measures satisfaction levels with LTC service including measures ranging from the convenience of the service to the cost of the service. The table below sets out the percent of survey respondents that agreed or strongly agreed with statements regarding the service for the 2018 survey.
Voice of the Customer Perceptions – 2018 Survey
| Service Statement | 2018 |
| Bus routes are conveniently located | 77% |
| There is enough seating on the bus | 64% |
| The service operates at the times I need it | 68% |
| The service operates on the days that I need it | 83% |
Satisfaction levels relating to the convenience of the service and availability of seating on buses has remained relatively consistent over the three waves of the survey. As indicated in the table above, the two areas of conventional service that customers are least satisfied with are the availability of seating on the bus and the times in which the service operates. The 2019 Service Plan saw the introduction of extended service to 1am (previously midnight) on 11 routes Monday through Saturday, as well as some further enhancements to services on the weekends. The 2020 Service Plan Framework looks to expand upon the extended service hours on the rest of the system over the next five years.
Another area of London Transit’s service measured by the Voice of the Customer surveys covers service performance expectations. The table below sets out the percent of survey respondents that agreed or strongly agreed with statements regarding service delivery.
Voice of the Customer Perceptions
| Service Statement | 2018 |
| Bus gets me to destination in reasonable time | 76% |
| Bus runs on time | 49% |
Both the Voice of the Customer survey and customer contacts are reflective of a customer’s perception of the service, based on their experience. As was the case in 2018, on time reliability decreased on many routes through the 2019 construction season due to detours and navigating through construction zones.
Average On-Time Performance for PM Peak (4PM-6PM) Chart
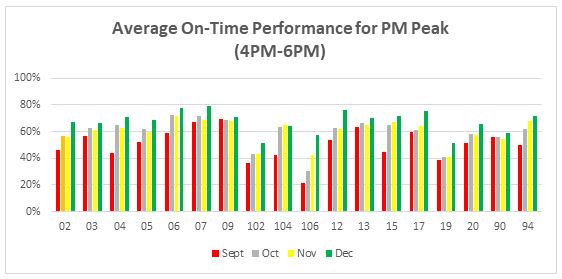
As illustrated in the graph above, on-time performance in 2019 improved significantly in December 2019, once the construction season came to a close. Planned construction projects in 2020 are anticipated to have significant negative impacts on the on time reliability of the service during the period of construction.
In addition to the Voice of the Customer surveys, customer satisfaction levels with service performance are measured through tracking both the number and nature of customer contacts received via email, social media, and phone. When considering these numbers, it is important to recognize that not all contacts are investigated and as such, have not been confirmed as an accurate characterization of the event. Contacts that are serious in nature or those in which the customer requests a response are all investigated.
As set out in the following chart, service performance complaints expressed in terms of 100,000 riders had been trending upward since 2016. In 2018, the trend reversed, taking this measure back below that of 2016. The downward trend continued in 2019 with a decline to 5.76 complaints per 100,000 riders. This overall decline is somewhat surprising given the significant impacts that construction had on the service reliability and convenience for a significant portion of 2019. The trend could however be reflective of the increased communication efforts established in 2018 and continued through 2019, intended to provide customers with real-time service information as well as up-to-date detour information via Twitter and the LTC website.
The charts below provide an overview of the total number of complaints and compliments as well as a breakdown of same by category which provides the opportunity for further analysis.
Customer Contacts – Service Performance Chart
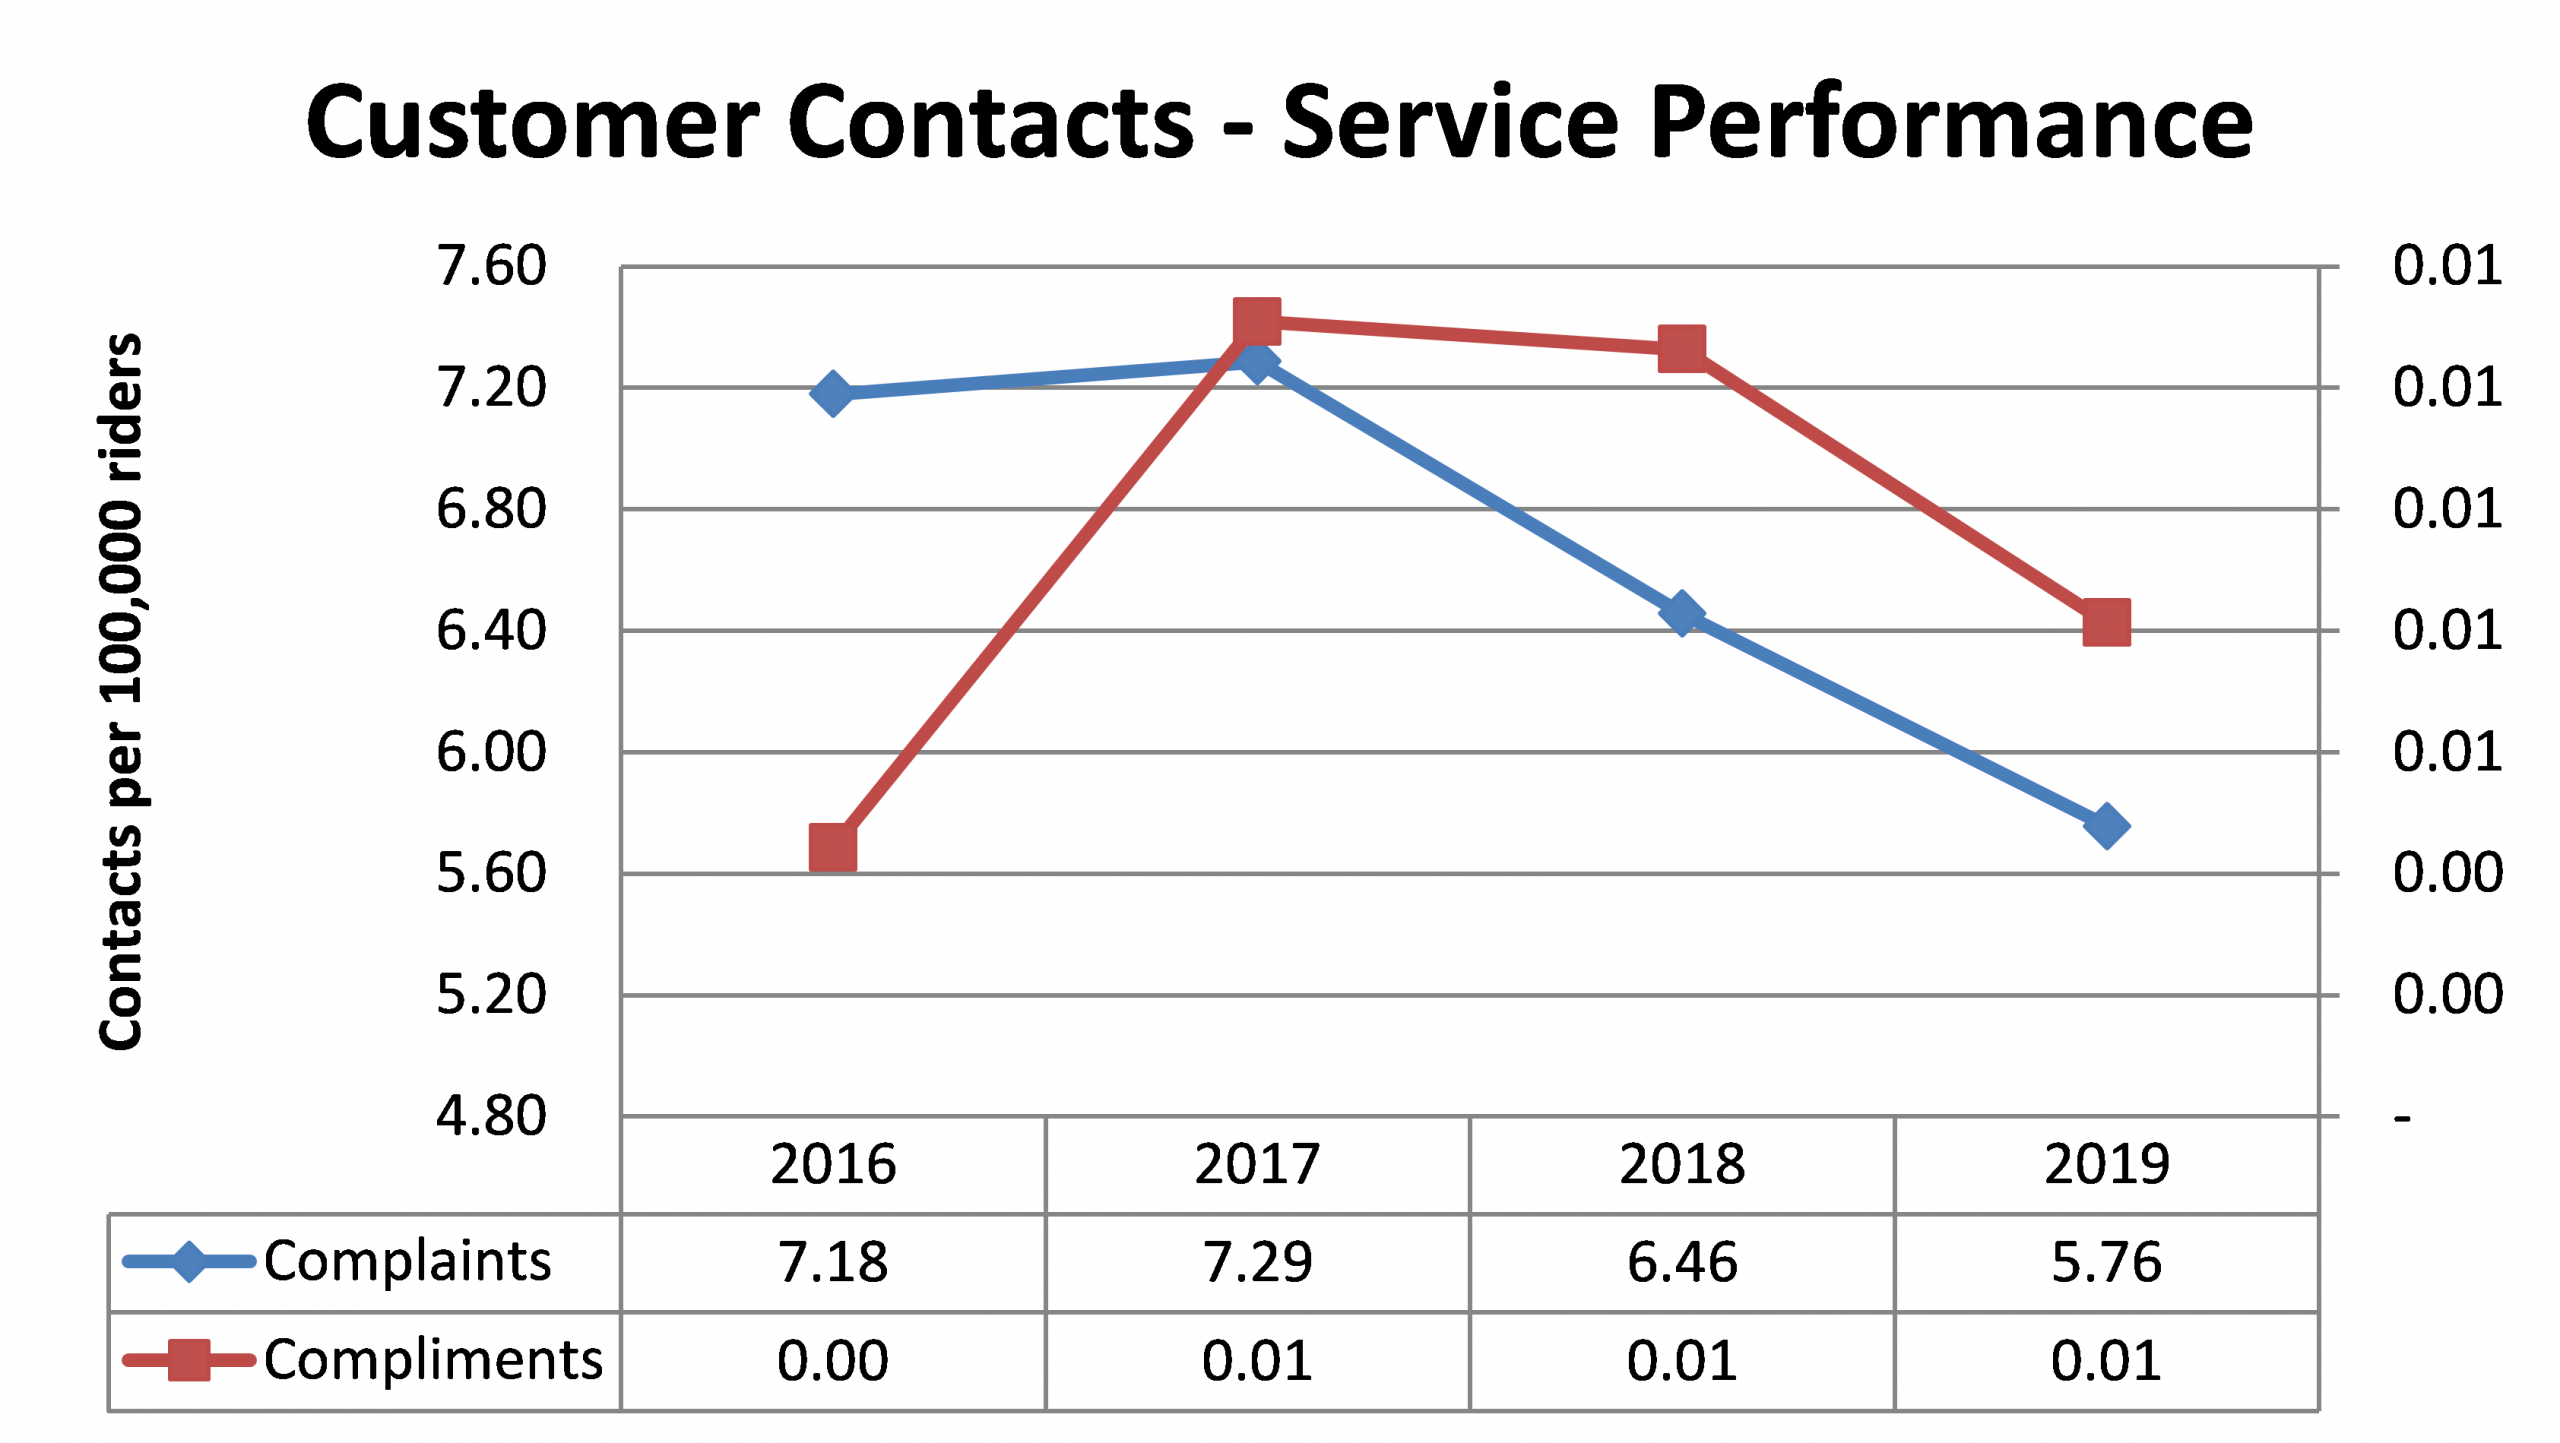
As important as the overall number of complaints received, is the nature of the complaints, all of which are analyzed to assess the impacts of the previous years’ service plan changes as well as to plan for future service changes. The table below sets out a breakdown of the number of service complaints over the four-year period by category, as well as a percentage change in each category over the period.
Total Service Performance Complaints by Category 2016-2019
| Complaints – Service | 2016 | 2017 | 2018 | 2019 | % Change |
| Detour/off route | 122 | 141 | 115 | 71 | -42% |
| Early schedule | 223 | 237 | 106 | 81 | -64% |
| Late schedule | 460 | 515 | 521 | 462 | 0% |
| Missed passenger – drove by | 313 | 303 | 324 | 370 | 18% |
| Missed passenger – not at stop | 375 | 374 | 375 | 341 | -9% |
| Overcrowding | 78 | 60 | 58 | 55 | -29% |
| Transfer connection | 49 | 40 | 34 | 36 | -27% |
| Total | 1,620 | 1,670 | 1,533 | 1,416 | -13% |
| Per 100,000 riders | 7.18 | 7.29 | 6.46 | 5.76 | -20% |
The top category of complaints over the four-year period has remained “late schedule”. While significant resources were applied to service changes over this period to address a service that was operating at/or exceeding capacity, the number has remained relatively consistent. The customer’s level of frustration with service reliability was echoed in the Voice of the Customer results from 2018. As indicated earlier in this report, the service disruptions resulting from the lengthy and expansive construction projects in 2019 are attributed to the continued high level of contacts on this issue. Given the extensive impacts the 2020 construction season is anticipated to have on transit services, a communications campaign will be launched in the coming weeks forewarning customers of the potential for service delays and to plan accordingly. In an effort to allow budget allocations to address scheduling issues associated with the annual service plan, budgeted hours in 2019 were allocated to post September service changes. This approach allowed for schedules to be adjusted after evaluating actual on road experience with the new service plan more quickly, leading to better schedule adherence.
The second highest category over the period is “missed passenger”, either “drove by” or “not at stop”. “Missed passenger drive by” and “missed passenger not at stop” are differentiated by the customer providing information as to whether or not they were at the physical stop at the time of the bus passing.
The continued decline in the number of “detour – off route” complaints in 2019, notwithstanding the significant detours and service interruptions experienced throughout the year is indicative that increased efforts at communicating up-to-date information to customers through all available means was effective.
“Early schedule” complaints have also continued to decline which is indicative of the focus applied to this issue by the Operations department in 2018 and 2019. Service monitoring, including the review of AVL data, riding routes that have a higher rate of schedule adherence issues and discussions with Operators driving those routes, led to information that was shared with the Planning department to make adjustments to schedules where possible, that result in better schedule adherence.
The other factor that can impact service delivery is service interruptions stemming from vehicle breakdowns. The table below sets out the mean kilometers between service interruptions, further broken down between those requiring the bus to be changed off and returned to the garage and those that could be fixed on-route by the mobile mechanic. While both categories represent an inconvenience to customers and an interruption to service, those that can be addressed by the mobile mechanic on-route cause less of a disruption.
Mean KMs Between Service Interruptions – 2016-2019
| Description | 2016 | 2017 | 2018 | 2019 |
| Service pull-ins | 2,434 | 2,323 | 2,406 | 2,305 |
| Mean kms between pull ins | 5,027 | 5,403 | 5,359 | 5,810 |
| Year over year change | 10% | 7% | -1% | 7% |
| In-service repairs (mobile mechanic) | 2,562 | 2,854 | 3,053 | 3,158 |
| Mean kms between in-service repairs | 4,776 | 4,398 | 4,223 | 4,241 |
| Year over year change | 9% | -8% | -4% | 2% |
In-service repairs (road service calls) and service pull-ins have a negative impact on the quality of customer service e.g. schedule adherence. Such events are inherent in public transit operations given such factors as weather and road conditions, the constant start/stop nature of the operation and the increased complexity and sensitivity associated with bus systems and related ancillary equipment (e.g. Automatic Vehicle Location (AVL), electronic fare boxes, smart card equipment, etc.).
Service pull-ins, measured in terms of mean revenue kilometers between incidents has continued to improve over the four-year period. This category is the most disruptive of the two, as it requires customers to vacate the bus and transfer to a replacement bus. As such, efforts are made to identify the issues resulting in these instances, and equipping the mobile mechanic, where possible, to rectify these issues on road. This strategy is reflected in the increased number of in-service repairs over the period. As part of the performance monitoring and quarterly review process, the Fleet and Facilities department breaks both of these categories down to determine the cause of the incident (i.e. engine, battery, electrical, dirty bus, etc.), and implements/modifies programs to mitigate same going forward.
Impressions of Operator Performance
Another area of London Transit’s conventional service measured by the Voice of the Customer surveys covers Operator performance expectations. As set out in the table below, survey respondents indicated a high level of satisfaction with Operator performance. As the table also indicates, customers indicated their high level of confidence in LTC Operator’s knowledge of the system.
Voice of the Customer Perceptions
| Service Statement | 2018 |
| The bus is well driven | 89% |
| Bus drivers are helpful and courteous | 79% |
| Bus drivers are knowledgeable about the transit system | 86% |
Consistent with service related contacts, customer contacts (complaints and compliments) regarding Operator performance are also tracked and trended. Performance results for 2016 through 2019 with respect to Operator complaints are set out in the following table. When comparing the number of complaints from previous years, either in total or by category, it is important to remember that ridership and service levels have also increased. The total complaints per 100,000 kilometers provides a normalized indication of the level of escalation in complaints year over year.
Total Operator Complaints by Category 2016-2019
| Complaints – Operator Performance | 2016 | 2017 | 2018 | 2019 | % Change |
| Speeding | 38 | 46 | 42 | 40 | 5% |
| Unsafe manner | 428 | 327 | 445 | 426 | 0% |
| Deadheaded | 28 | 20 | 21 | 23 | -18% |
| Idling | 8 | 8 | 6 | 13 | -18% |
| Drive through red light | 22 | 35 | 27 | 45 | 105% |
| Not stopping at stop sign | 9 | 7 | 17 | 16 | 78% |
| Yield to Bus | 53 | 45 | 46 | 61 | 15% |
| Quality of Ride | 54 | 66 | 53 | 54 | 0% |
| Splashed Pedestrian | 9 | 5 | 10 | 10 | 11% |
| Driving | 649 | 559 | 667 | 688 | 6% |
| Attitude/Treatment | 674 | 603 | 607 | 651 | -3% |
| Presentation | 15 | 7 | 59 | 47 | 213% |
| Smoking | 11 | 14 | 16 | 8 | -27% |
| Cell Phone | 28 | 44 | 27 | 26 | -7% |
| Missed stop requested | 59 | 38 | 55 | 71 | 20% |
| Service received | 787 | 706 | 764 | 803 | 2% |
| Total | 1,436 | 1,265 | 1,431 | 1,491 | 4% |
| Per 100,000 kilometres | 11.74 | 10.08 | 11.12 | 11.08 | -6% |
As indicated in the table, in total, complaints in 2019 increased slightly over 2018; however, over the four-year period, the number of complaints per 100,000 kilometers travelled has decreased by 6%.
Driving related Operator complaints increased to the highest number over the four-year period in 2019, with the highest number of complaints relating to “driving”. The increase in “driving” complaints in 2019 can be largely attributed to complaints received about buses travelling on detour (as the result of numerous construction projects) on streets that typically don’t see bus traffic. The types of complaints received in this area include speed, braking, merging, and turning, all of which the complainant has perceived were conducted in an unsafe manner. The size of a standard bus, coupled with the noise at acceleration being louder than a typical vehicle, often lead to the assumption that the bus is speeding, however, in the majority of the complaints of this nature that have been investigated, it is found that the bus is travelling well within posted speed limits.
Total complaints with respect to ‘service received from the Operator’ also increased in 2019 to the highest total in the four-year horizon. The largest number of complaints in this category (representing approximately 79% of the total) relate to driver attitude and passenger treatment.
In the case of complaints alleging a significant Operator performance issue, an investigation is completed, which can include any or all of the following; interview with the Operator and complainant, assessment of AVLC data, review of the bus’ audio/visual system (noting there is a strict protocol for accessing the system recordings). It should be noted that contacts received from customers are based on the customer’s perception of the incident, and are not always consistent with what actually occurred. In all situations, when requested, a response regarding the assessment is provided to the customer who filed the contact.
Operator performance compliments are also tracked and trended. In 2019, overall Operator performance compliments are the lowest over the four-year period with a decrease of 22% for same. The chart below sets out the trend in Operator compliments over the period of 2016 through 2019.
Total Operator Compliments by Category 2016-2019
| Operator Performance | 2016 | 2017 | 2018 | 2019 | % Change |
| Attitude/Treatment | 272 | 267 | 249 | 213 | -22% |
| Presentation | 1 | 3 | 9 | 1 | 0% |
| Service received | 273 | 270 | 258 | 214 | -22% |
| Per 100,000 riders | 1.21 | 1.18 | 1.09 | 0.87 | -28% |
Impressions of Service Safety
As set out earlier in this report, 89% of respondents of the 2018 Voice of the Customer feel that LTC vehicles are operated in a safe manner.
Accident/incident reports in 2019 remained relatively consistent with the number of reports in 2018. The tables below set out the total number of reports for each year for the period of 2016 through 2019.
Summary of Motor Vehicle Accidents – On Road 2016-2019
| Description | 2016 | 2017 | 2018 | 2019 |
| Number of reports | 302 | 291 | 359 | 369 |
| · Preventable | 130 | 136 | 175 | 152 |
| · Non-Preventable | 172 | 155 | 184 | 217 |
| Total per million km | 24.6 | 24.4 | 27.9 | 27.5 |
| Per 100,000 service hours | 50.1 | 47.4 | 56.5 | 56.5 |
| Mean km between reports | 40,514 | 42,046 | 34,082 | 34,882 |
| Year over year percent change | 4% | -19% | 2% |
Preventable motor vehicle accidents (MVAs) decreased by approximately 13% over the previous year, the first decrease seen over the period. The major categories for preventable MVAs continue to be striking fixed objects (lamp posts, parked cars, etc.) and sideswipes. As with customer contacts, the increases in service hours year over year need to be taken into account when assessing trends with motor vehicle accidents. When looking at the total motor vehicle accidents per million kilometers travelled and per 100,000 service hours, both remained relatively consistent over 2018. In 2019, through assessment it was found that additional training was required regarding bus clearance issues. As such, LTC’s Defensive Driving Program was updated to increase the focus on ensuring proper clearance and rolled out in the New Operator Training Program in mid-2019. In 2020, this enhanced training has been added to LTC’s Defensive Driving Refresher Program, and all Operators will undergo same on the current three-year cycle. This is an area that will continue to be monitored closely in 2020, to continue the assessment on the impacts of the enhanced training. In addition, education campaigns regarding safe driving practices relating to the most common accident types continue to run on LTC communication boards in an effort to curb this trend.
Summary of Passenger Falls – 2016-2019
| Description | 2016 | 2017 | 2018 | 2019 |
| In motion | 46 | 28 | 23 | 26 |
| Stationary | 5 | 13 | 17 | 17 |
| Total | 51 | 41 | 40 | 43 |
| Per million km | 4.2 | 3.3 | 3.1 | 3.2 |
| Year over year percent change | -20% | -7% | 3% |
Passenger falls increased very slightly in 2019 as compared to 2018.
The nature and extent of accidents/incidents are reflective of a number of factors including:
- changing and severity of weather conditions;
- increased road congestion and issues of road condition; and
- heightened service and customer service expectations.
All passenger fall reports are reviewed, including, as warranted, accessing audio/visual system recordings to investigate the event, all of which is shared with the Commission’s adjuster and legal counsel. The management of accidents/incidents is critical to providing passengers with a safe trip as well as mitigating risk and liability. In terms of cost and risk, the vast majority of the reported accidents/incidents are minor in nature reflecting in part the broad definition of what constitutes an accident/incident. The management program includes remedial training as appropriate, and the ongoing refresher defensive driving program which calls for each Operator to complete the program once every three years.
Access to LTC Information
The following table provides a breakdown of the various methods of Customer access based on the new tracking systems, which were implemented in 2018.
Summary of Customer Access – LTC Information
| Description | 2018 | 2019 | Percentage Change |
| Calls/Visits (millions) | 0.089 | 0.088 | (1.1)% |
| Information line – answered calls(1) | 0.236 | 0.184 | (22.0)% |
| Interactive voice response(2) | 1.690 | 1.647 | (2.5)% |
| Website – main site visits(3) | 0.061 | 0.087 | 42.4% |
| Website – Infoweb real-time(3) | 2.076 | 2.006 | (3.4)% |
| Calls/visits per million rides | 0.087 | 0.082 | (6.7)% |
| Percent Make Up | |||
| Information line – answered calls | 4.3% | 4.4% | |
| Interactive voice response | 11.4% | 9.2% | |
| Website – main site visits | 81.4% | 82.1% | |
| Website – Infoweb real-time | 2.9% | 4.3% | |
| Total | 100.0% | 100% |
- Information Line statistics are for the hours of 6 a.m. – 10 p.m. Monday through Friday and 8:30 a.m. – 4:30 p.m. on weekends and statutory holidays. Service information provided by staff is based upon real-time information. Staff also assists with trip planning.
- Interactive Voice Response (IVR) – IVR is a phone system that utilizes voice recognition technology to assist customers with providing real-time information by stop for conventional transit.
- The numbers included in these items are based on Google Analytics, which measures sessions vs visits. A session is defined as the amount of time a user is actively engaged with the site, and all usage within that engagement is measured as one session.
The use of IVR and the LTC website continue to represent the majority of customer interactions with London Transit. Google Transit trip planning and real-time information are also widely utilized; however, Google does not share visitor statistics with participating transit properties, so these numbers are not included in the above table. In addition to the above access points, the LTC currently provides approximately 650,000 printed route schedules (noting the schedules are also available for printing or downloading from LTC’s website) and 50,000 printed ride guides.
Going Forward
One of the key initiatives for the 2019-2022 Business Plan is to enhance the marketing and promotion of LTC with an emphasis on the value it brings to the community. In 2019 the “Your Transit” campaign was launched promoting key benefits of transit including, Your Time, Your Planet, Your Community, Your Journey and Your Way Home. The promotion of London Transit will continue throughout 2020 with enhanced marketing on the corporate website and social media.
Another initiative included in the 2019-2022 Business Plan is the assessment of other methods of interacting with and getting feedback from both existing and potential customers as well as other stakeholders. In 2018 “pop-up” public engagement sessions were held at bus stops and terminals. The information provided by passengers was very useful and reached a different demographic than normally attends more formal drop-in sessions. As a result, this method of reaching our customers was expanded in 2019 and will continue to be an important part of the planning process in 2020. Plans for 2020 include the assessment of opportunities to increase the opportunity for interactions with the public.
Recommended by:
Shawn Wilson, Director of Operations
Concurred in by:
Kelly S. Paleczny, General Manager