Staff Report #1
May 25, 2022
To All Commissioners
Re: Zero-Emission Bus Implementation Strategy
Recommendation
That the Commission:
- APPROVE IN PRINCIPLE the Zero-Emission Bus (ZEB) Fleet Implementation and Rollout Plan;
- DIRECT administration to utilize the Plan as a framework for the transition to a Zero Emission Conventional Transit Fleet;
- DIRECT administration to utilize the Plan to support funding applications as determined in cooperation with civic administration; and
- DIRECT administration to confirm London’s participation in the CUTZEB joint procurement initiative at an estimated cost of $80,000 and finalize the necessary contracts with CUTZEB.
Background
Since the beginning of 2020, administration has been working to complete the necessary steps to begin the transition to a zero-emission conventional bus fleet. This work has included the following:
- Commission approval for the completion of a Fleet Electrification Analysis Study in January 2020 (see Staff Report #4 dated January 29, 2020);
- Completion and presentation of the Fleet Electrification Analysis Study to the Commission at the November 25, 2020 meeting (see Staff Report #1 dated November 25, 2020);
- Commission approval for the completion of a Zero Emission Bus Implementation Strategy in April 2020 (see Staff Report #1 dated April 28, 2021);
- Commission direction for Administration to continue discussions with CUTRIC with respect to London’s participation in a Phase 2 ZEB trial and joint procurement initiative (see Staff Report #1 dated April 28, 2021);
- Commission direction for Administration to work with civic administration to create a Business Case for the initial zero-emission bus implementation of 10 40’ battery electric buses and seven chargers (3 overhead and four plug in) to be forwarded to Municipal Council as part of the 2022 budget deliberation (see Staff Report #3 dated August 25, 2021);
- Commission direction for administration to continue discussions with CUTRIC with respect to London’s participation in a Zero-Emission Bus (ZEB) turn-key joint procurement initiative (see Staff Report #3 dated August 25, 2021); and
- Municipal Council approval for the Zero-Emission Bus Business Case with an upset limit capital expenditure of $25.960 million noting no source of funding was identified (see Communication #2 dated January 26, 2022)
Throughout this period, administration has also continued to participate in industry discussions, forums and working groups dealing specifically with lessons learned and best practices from ZEB projects that are currently underway at other transit agencies.
The completion of the Zero-Emission Bus Fleet Implementation and Rollout Plan is a critical step in the process for a number of reasons. A plan of this nature is a key requirement in order to apply for the Infrastructure Canada supported Zero Emission Transit Fund (ZETF) as it is viewed as a critical step in order to ensure a smooth and well-planned transition that has included consideration of operational and technical challenges associated with such a conversion. In March of 2022, Infrastructure Canada announced that the Canadian Urban Transit Research and Innovation Consortium (CUTRIC) had been selected to support transit systems by producing comprehensive and accurate zero emission transit bus electrification and planning studies. The preparation of these studies is eligible for funding under the ZETF; however, given the London Transit study had been awarded and in progress prior to this announcement, it is not eligible for funding under this program. As approved by the Commission at the April 28, 2021 meeting, the costs related to the preparation of this report are funded with Provincial Gas Tax.
CUTRIC has completed the Zero-Emission Bus Fleet Implementation and Rollout Plan (The Plan), noting the areas they were asked to cover include:
- Assessment of the current state
- Evaluation of electrical power services
- Review of operational goals and scenario development
- Comparative analysis of available vehicles and charging systems
- Infrastructure gap analysis and requirements identification
- Implementation planning and costing
The Plan, which touches on all of the aforementioned areas, is set out in Enclosure I (for Commissioners only) and is broken down into a number of sections, each of which is discussed at a high level in the remainder of this report.
Route Analysis and Operational Modifications
The Plan discusses the details of the RoutΣ.i™ 2.0 modelling tool which CUTRIC utilized in the completion of the Detailed Fleet Electrification and Route Analysis Report. This significant portion of work had subsequently been completed by CUTRIC but has been revisited in this report. The modelling considered seven different zero-emission vehicle model configuration options as set out in the following table.
Vehicle Model Configurations
| Parameter | Bus #1 | Bus #2 | Bus #3 | Bus #4 | Bus #5 | Bus #6 | Bus #7 |
| Vehicle type | BEB | BEB | BEB | BEB | BEB | FCEB | FCEB |
| Vehicle size (ft) | 40 | 40 | 40 | 40 | 60 | 40 | 60 |
| Battery capacity | 500+ | 400+ | 500+ | 300+ | 500+ | 50+ | 100+ |
| H2 tank capacity | – | – | – | – | – | 30+ | 60+ |
| Depot charging/
refueling time |
~3.5h | ~3h | ~4h | ~2.5h | ~3.5h | < 10min | < 15min |
The Route Analysis looked at the success rates for converting each one of the current LTC routes to zero-emission giving consideration to a number of factors including but not limited to transit schedules, traffic impediments, topography, non-revenue distance travelled, and duty cycles by time of day and day of week. In the case of the BEB models, further analysis was done between depot charging and opportunity charging (on-road) options. The data generated from these factors was applied to a simulation to determine the energy consumption in each route/run scenario. The following graph sets out the system-wide success rates of each of the options modelled without any schedule optimization applied (i.e. runs would all continue to operate as currently scheduled).
Success Rates of ZEBs in LTC Systems
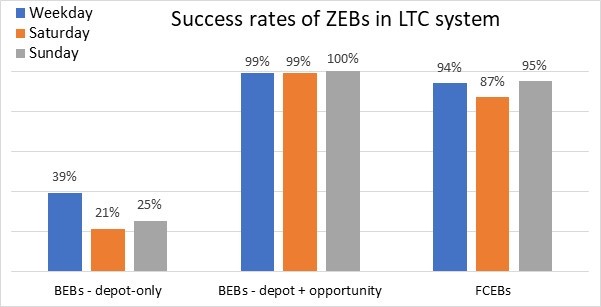
Subsequent to the initial route analysis, work was undertaken to identify operational modifications that would allow LTC to optimize its system, considering the technological limitations of BEBs as well as the associated capital and operational costs. The charger optimization ensures that the capital costs of vehicles and charging infrastructure is minimized by finding a balance between installing additional chargers in different locations and deploying additional buses to cover the portion of the service that could potentially fail by not having access to opportunity charging. A total of nine optimal locations are identified for the installation of opportunity chargers with an average of two chargers per location.
The operation modifications also include the splitting of the service of some vehicles in the system that could not be successfully electrified with the technology assessed after the charger optimization process established the location and number of chargers available. The services of those vehicles are redistributed into a slightly larger number of vehicles. This service splitting would result in a replacement ratio of 1.105:1 between BEBs and diesel buses. Both the vehicle service schedule and its charging schedule while in the depot are optimized to reduce power demand charges and the size of the required charging infrastructure.
Applying the results of the modelling completed with these optimization would result in the addition of 20 buses to the current fleet in order to maintain the current (pre-pandemic) level of service with a BEB fleet. In addition to the incremental capital costs associated with the additional bus requirements under this scenario, there is also incremental operating costs associated with the required schedule modifications required to accommodate the charging requirements. Until such time as the affected routes are operational, it is difficult to determine the actual costs associated with the required modifications noting that in addition to the increased time required, there may also be impacts associated with provisions in the collective agreement.
Similar analysis was completed with respect to the operational modifications that would allow LTC to optimize its system, considering the technological limitations of FCEBs as well as their capital and operational costs utilizing the same considerations as those for BEBs. The number of optimizations required is significantly lower than those of the BEB counterpart, the service of fewer vehicles must be split and no adjustments to the schedule of vehicles are needed. In this case, given all refueling is assumed to take place at the depot, the limited routes that could not be successfully converted to FCEB based on the modelling would need to split into two, resulting in a replacement ratio of 1.058:1 between FCEBs and diesel buses. This would equate to the addition of 11 buses to the current fleet in order to maintain the current (pre-pandemic) level of service with a FCEB fleet. Given the limited requirements for schedule optimization with this scenario, the incremental operating cost impacts would be limited.
Energy Requirements
The energy and fuel requirements imposed by the two electrification solutions (BEBs and FCEBs) are calculated and summarized as part of the input into the total cost of operation. This summary presents not only the volumetric demand (kWh and kgH2) but also the power and flux demand (kW and kgH2/day) which dictates the size of the required charging and refueling infrastructure. A full-fleet electrification using BEBs would require a monthly consumption of approximately 1.8 GWh of electrical energy with two garages reaching power levels of approximately 1 MW at the Wonderland facility and 2 MW at the Highbury facility. These consumption estimates assume that a charging schedule is implemented which appropriately distributes the charging of vehicles over the period of time they are parked in the garage. It is important to note that while a charging schedule significantly reduces the size of the required charging infrastructure, it requires the implementation of a smart charging program which allows for all buses to be plugged in once they are parked but actual charging of the bus would only start according to the schedule designed for depot charging. This software automatically directs power to a subset of the vehicles plugged in until such time as all vehicles are fully charged and ready for service.
The power level of opportunity charging locations varies between 200 kW and 1 MW depending on the number of buses the charger is estimated to support.
Electrification using FCEBs would require the monthly consumption of approximately 111,800 kg of hydrogen fuel with almost 3,000 kg of hydrogen being consumed in a typical weekday.
Cost of Ownership Comparisons
A comprehensive cost analysis was undertaken utilizing the aforementioned optimizations and calculations to determine the total cost of ownership for a diesel bus, BEB and FCEB. The total cost of ownership analysis includes the procurement of vehicles, charging/refueling infrastructure, and operational costs of energy/fuel and maintenance. The incremental costs associated with the labour required to operate and maintain the additional buses required in each of the BEB and FCEB scenarios has not been included in the total cost of ownership.
The electricity costs were calculated based on London Hydro rates, giving consideration to the times in which the hydro would be utilized noting peak demand pricing is in place for consumption during peak hours (5pm-7pm). The costing calculation also assumes the existence of a smart charging system at both facilities, which will help to schedule charging activity around the peak demand periods. Another option to reduce energy pricing is the installation of energy storage systems at both facilities, noting this stored energy would be drawn on during peak periods to avoid peak hour pricing. The cost of an energy storage system is approximately $500,000 per facility, and this stored energy would not be a significant benefit in the early years of fleet conversion given the relatively small number of buses being charged. As such, CUTRIC is not recommending proceeding with this option at this time, but notes it should be assessed as an option in the future as the zero-emission fleet continues to grow.
The cost calculations for hydrogen to operate an FCEB fleet are more difficult to calculate given its limited availability and associated price variances. For the purposes of the total cost of ownership calculation, a range of between $5/kg and $15/kg was considered and both are included in the overall comparison.
The capital costs associated with each of the vehicle options is set out in the table below. The pricing is based on a survey of vehicle manufacturers completed for the purpose of this report.
Estimated Price Points for Buses
| Asset | Estimated price/unit (40-foot) | Estimated price/unit (60-foot) |
| BEB | $1.0 – $1.2 million | $1.4 – $1.6 million |
| FCEB | $1.2 – $1.7 million | $1.5 – $2.0 million |
| Diesel bus | $550k – $650k | $700k – $800k |
The second piece of capital cost associated with the conversion to zero-emission buses is the charging infrastructure. The costs set out in the table below are on a per unit basis, noting after the optimizations recommended in the report are undertaken, it is estimated that a total of 18 opportunity chargers and 27 depot chargers (18 at Highbury and nine at Wonderland) would be required for full fleet conversion. Estimated costs for charging infrastructure for BEBs, based on market surveys of current manufacturers, are set out in the table below. For the purposes of the total cost of ownership per bus calculations, the costs of the 27 chargers and related annual maintenance were totaled and divided by the total buses in the fleet. Based on these quantities and the estimated pricing in the table below, the total capital cost associated with the required charging infrastructure is estimated at between $13.4 and $15 million, and the annual maintenance costs would be approximately $2.7 million.
Capital Costs of BEB Charging Infrastructure
| Asset | Estimated price/unit (C$) |
| Depot chargers (150 kW) | $100k – $125k |
| Depot charger installation | up to $30k |
| On-route chargers (450 kW) | $400k – $450k |
| On-route charger installation | up to $150k |
| Annual charger maintenance costs | up to $60k |
The cost of fueling infrastructure for FCEBs is one of the most uncertain parameters across the industry and depends heavily on the scale of the fuel cell bus deployment. In the event LTC converted the entire fleet to FCEBs, the storage capacity for no less than 10,000kg of fuel would be required, noting at this rate, three deliveries per week would be required to operate the fleet. Based on the known pricing of this type of infrastructure built for BC transit and adjusted for inflation, the estimated cost of the fueling infrastructure required for an FCEB fleet in London would be $8.5 million.
The next component in the total cost of ownership is the operating costs associated with the fuel and maintenance of each of the bus options. For the diesel bus, the average pricing per litre just prior to the onset of the war in Ukraine ($1.10/L) and a higher price of $2.65/L were used. The higher price was chosen as this is close to the break-even point between diesel and BEB in terms of total cost of ownership. If the current trends in diesel price increases continue going forward, it is estimated that the price of $2.65/L would be reached within a five year horizon. The table below sets out the estimated operational costs over the 12 year life of a diesel bus.
Operational Cost Estimate for a Single Diesel Bus (12-year service)
| Variable | NPV 40-foot | NPV 60-foot | ||
| Fuel cost | $1.10/L | $2.65/L | $1.10/L | $2.65/L |
| $320,019 | $770,954 | $463,700 | $1,117,096 | |
| Maintenance cost | $296,863 | $296,863 | ||
The operational costs for the BEB option include electricity and maintenance costs as well as the cost of battery replacement, which is anticipated to be required at the six year mark. The maintenance costs for the BEB are considerably lower than a diesel bus given that BEBs have simpler propulsion systems with fewer moving parts, no engine fluids, and extended brake life from regenerative braking. The table below sets out the estimated operational costs over the 12 year life of a BEB.
Operational Cost Estimate for a Single BEB (12-year service)
| Variable | Net present value (NPV) |
| Electricity cost | $197,573 |
| Maintenance cost | $154,369 |
| Battery replacement cost | $145,631 |
The operational costs for the FCEB option include the cost of hydrogen as well as maintenance costs which are based on a study conducted by the National Renewable Energy Laboratory. In addition, it is anticipated that the fuel cell module will require replacement at the six year mark. The table below sets out the estimated operational costs over the 12 year life of a FCEB.
Operational Cost Estimate for a Single FCEB (12-year service)
| Variable | Net present value (NPV) | |
| $5/kg | $15/kg | |
| Fuel cost | $274,302 | $822,905 |
| Maintenance cost | $261,240 | |
| Fuel cell module replacement cost | $165,049 | |
The following graph provides a summary comparison of the total cost of ownership for each of the 40’ bus options based on a 12 year life of the bus. The same analysis was completed for the 60’ bus option and had similar results.
40 ft Bus Total Cost of Ownership Comparison (12 years)
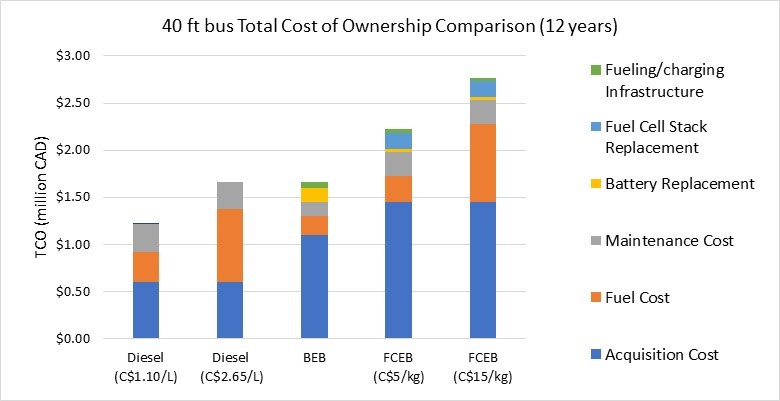
All ZEB models are found to present a higher TCO than regular diesel buses if the diesel price point of $1.10/L is considered. FCEBs do not present a competitive business case because its TCO is more than 30% higher than the diesel counterpart even when considering the lower hydrogen fuel price limit ($5/kg) and the higher diesel price point ($2.65/L) for 40-foot vehicles. BEBs, on the other hand, present a TCO of approximately 37% higher than the diesel counterpart, assuming the diesel price point of $1.10/L. However, BEBs break even with diesel at the price point of $2.65/L for 40-foot vehicles.
Considering operational costs alone, BEBs are approximately 20% less costly on average than the diesel counterpart because savings are realized for energy/fuel and maintenance costs. For FCEBs, the relatively high cost of hydrogen dominates operational costs.
While costs are an important factor in the decision to transition to green technology, consideration must also be given to the environmental aspects associated with such a transition in the overall business case.
Life Cycle Analysis
In order to ascertain the environmental impacts of each of the bus options, a life cycle analysis (LCA) which assesses the environmental impacts of a product over its whole life cycle (cradle to grave) was undertaken. The outputs are comprehensive and include the main environmental impact indicators of vehicle manufacturing, charging/refueling infrastructure manufacturing and energy/fuel supply chain. One of the main indicators is the potential of global warming (GWP) which is illustrated for each of the 40’ bus options in the following graph.
40-foot Bus Global Warming Potential (GWP 100 years)
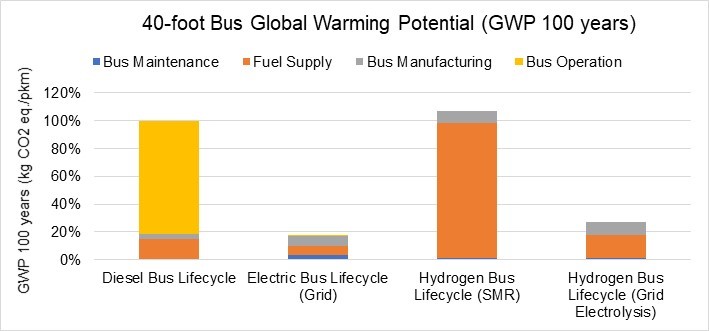
A 100-year time span is adopted for GWPs, meaning that the parameter measures the warming effects of greenhouse gases introduced over 100 years following emissions. As illustrated in the graph, the GWP for BEBs results in a number that is less than 20% of the corresponding result for diesel buses. For FCEBs, the global warming potential can be almost 30% of the diesel counterpart if electrolytic hydrogen is used to power the fleet. If steam methane reformed hydrogen is used to power FCEBs in LTC’s fleet, the potential of global warming is slightly higher than the diesel counterpart.
Also illustrated in the graph is the GWP emissions of the diesel buses are dominated by tailpipe emissions from the bus operation phase. Due to the low carbon intensity factor of the Ontario grid, BEBs charged using grid electricity result in significantly fewer emissions than the diesel counterpart. While FCEB tailpipe emissions are negligible in terms of global warming, emissions from hydrogen generation obtained from steam methane reforming (SMR) is considerable. The overall GWP is close to that of diesel vehicles. FCEBs fueled by electrolytic hydrogen generated using grid electricity also show a substantial reduction in life cycle emissions when compared with diesel buses.
Facility Requirements
The Plan also outlines the necessary retrofits required at each facility in order to move forward with the recommended fleet transition to zero emission buses. As input into this analysis, CUTRIC undertook inspections at both facilities in collaboration with different equipment manufactures as well as discussions with London Hydro. Given the Highbury facility has technically reached its useful life and is in need of replacement, the primary focus of this exercise was on the Wonderland facility as this is where the initial fleet of zero-emission buses will operate from. It is anticipated that the Highbury facility will be torn down and rebuilt prior to the zero emission bus fleet reaching 100 buses which can be accommodated at the Wonderland facility. This approach will ensure that no investment in infrastructure is undertaken at the Highbury facility prior to tear down.
CUTRIC investigated the maximum electrical service capacity applicable to the two LTC facilities with the collaboration of the power utility company, London Hydro. The Wonderland facility could be supplied with a maximum electrical capacity of 4.5 Mega Volt Amperes (MVA) while the Highbury facility could be supplied with a maximum electrical capacity of 10 MVA. At the present time, London Hydro advises that while currently there is available upstream capacity to supply 4.5 MVA (load of ~4,000 kW) at the Wonderland facility, some upstream grid reconfiguration and load balancing would be required to allow a continuous supply if the loading is close to the maximum service capacity. Loads in excess of this amount would require upstream work by London Hydro to provide additional capacity. Regarding the Highbury facility, if full rebuilding and bus servicing results in a projected peak demand in excess of 6,000 kW, a customer-owned substation would be required. The projected power loads necessary to charge BEBs (<2,000 kW for the Highbury facility and <1,000 kW for the Wonderland facility) are considerably lower than the maximum service capacity.
Facility retrofit and electrification requirements were assessed in detail for the Wonderland facility only given the status of the Highbury facility. With respect to a BEB solution at the Wonderland facility considerations for retrofit included electrical, mechanical, and architectural/structural. The assessment also looked a two scenarios, one that would cover the short term (and require upgrades as the BEB fleet grows), and one that while more costly up front, would cover mid to long term requirements.
Electrification Installation Costs – Wonderland Facility
| Category | Scenario 1 | Scenario 2 |
| Electrical | $ 289,971 | $635,502 |
| Mechanical | $116,000 | $251,775 |
| Architectural/ structural/civil | $70,000 | $441,250 |
| Total (with 25% contingency) | $594,964 | $1,660,659 |
In terms of the electrical costs, Scenario 1 includes four depot charges and load control measures as well as an upgrade to the current transformer serving the facility. This option is presented given it represents the fastest, cheapest and least complex route to enabling support for BEBs at the Wonderland facility, however it should be noted that it will only have the capacity to support up to 30 BEBs before requiring further infrastructure modifications. Scenario 2 includes the addition of a second transformer at the facility that would run in parallel with the existing transformer. This addition would support up to 100 BEBs at the Wonderland facility, which is the current capacity. A further consideration, not included in the costs above, is the installation of a generator with a capacity of ~2 MW. This generator would serve as a backup power supply in the event of power outages at the facility. Without a backup generator, an extended power outage at the facility could result in buses not being available for service. While this may be acceptable during the initial stages of transition when backup diesel buses may be available, it will be critical as the ZEB fleet grows in order to ensure transit services are maintained in the event of power outages.
The mechanical cost estimates in the table include consideration for power cabinets and overhead raceways to feed the chargers located in the bus parking area of the facility. In Scenario 2, a dedicated charger room is included which would house all mounting pads, electrical disconnects, power cabinets, and dedicated heating ventilation and air conditioning (HVAC) systems required to support the operation of up to 100 BEBs. Also included in both scenarios is the cost estimate for the installation of a new two-metric-tonne crane in one of the service bays which will be required for the removal of batteries from the buses as well as other maintenance work.
The architectural costs are primarily related to the addition of a new enclosed electric service room (Scenario 2) in the southwest corner of the facility, built to house the new power cabinets and equipment.
London Hydro states that they would require 6-12 months to get new transformers delivered to service the new building loads. In the interim, construction to prepare the Wonderland facility to receive the chargers would also need to be undertaken. The estimated timelines associated with the required construction is four months for Scenario 1 and six months for Scenario 2.
In terms of facility requirements for a FCEB fleet, a number of options were considered given the different manners in which hydrogen can be delivered and stored. The table below sets out the details of the four scenarios considered as well as the estimated costs for same.
FCEB Hydrogen Fueling Yard Scenarios
| Item | Scenario 1.1 | Scenario 1.2 | Scenario 1.3 | Scenario 2 |
| Description | Mobile tube trailers gas delivery and gaseous storage | Permanent installation of gaseous supply storage tank, gaseous delivery | Permanent installation of gaseous supply storage tank, liquid delivery | Permanent installation of liquid supply storage tank, liquid delivery |
| Hydrogen state | Gas | Gas | Gas | Liquid |
| Delivery state | Gas | Gas | Liquid | Liquid |
| Number of FCEBs | up to 12 | up to 12 | up to 12 | Up To 130 |
| Storage tank size | 900 kg | 900 kg | 900 kg | 10,000 kg |
| Installed components | Mobile trailer
Compressor Fueling storage Tank Control module Dispenser |
Supply storage Tank
Compressor Fueling storage Tank Control module Dispenser |
Vaporizer
Supply storage Tank Compressor Fueling storage Tank Control module Dispenser |
Supply storage
Tank Vaporizer Control module Fueling storage Tank Dispenser |
| Footprint (estimate) | 20′ x 50′ + Installed components | 20′ x 50′ + Installed components | 20′ x 50′ + Installed components | 30′ x 60’+ Installed components |
| Installation Costs | $632,125 | $660,250 | $851,125 | $876,125 |
Opportunity Charging Installations
London Hydro has indicated similar advance timelines for the work required to install opportunity chargers (9-12 months). This lead time would be utilized to obtain any required municipal or land owner approvals, order the charger, and contract and install the civil infrastructure to make the site ready for London Hydro to install the pad mount transformer and make connections.
While a number of locations have been recommended for potential placement of opportunity chargers, additional work must be undertaken by administration to confirm the viability of each location. In addition to the opportunity charging infrastructure, it is recommended that consideration be given for heavy asphalt or concrete to be used for the areas where the buses will be sitting to charge given the weight of the buses and the length of time they will be sitting under the charger.
Rollout of BEBs and Charging Infrastructure
CUTRIC recommends the initial purchase of 10 BEBs and six chargers (four depot and two opportunity) as the first steps toward the LTC fleet transition. This will provide LTC with the experience required to plan for and continue to transition the fleet over time. LTC would require approximately $1.8 million to retrofit the Wonderland facility (London Hydro connection costs included) and approximately C$15 million in the first year to procure the first buses and chargers.
While CUTRIC recommends that all bus replacements (17 each year) beginning the year following the initial procurement be BEB’s, administration believes that may be too aggressive as there will not have been a full year of operating experience covering all four seasons prior to the receipt of additional buses. Proper experience and assessments under all operating conditions will be critical in ensuring that operational issues have been addressed and service can continue to be met going forward as the fleet transitions. Administration will continue to discuss the issues associated with a rapid rollout of this nature, noting final decisions with respect to the number of buses and chargers in subsequent years won’t need to be determined for some time.
The LTC capital budget includes the costs associated with the replacement of 17 buses per year. To transition to BEBs, LTC would require incremental funding of approximately $16 million more per year than what would be required to continue operating the diesel fleet with the projected fleet growth. More detailed financial forecasts will be completed as part of the funding application and supporting business case.
Workforce Training and Development
The transition to ZEBs will significantly alter LTC service and operations at all levels. A change of this magnitude will require extensive change management and training as well as increased resources. Since battery technology is evolving rapidly, training processes are predicted to be an ongoing process even after the initial rollout of ZEBs. To understand best practices of operations, management and safety training, focus groups were conducted with manufacturers, transit agencies, consultancy groups and educational institutions to determine the best way forward. In terms of preparation for the transition to ZEBs, the following key points were highlighted.
Operations
- Pilot projects do not always produce the anticipated outcomes. An important step to overcome this challenge is job shadowing.
- It is crucial to hire subject matter experts such as project managers, IT professionals and mechanical engineers who can provide expertise to support the transition.
- Training with bus manufacturers on operations, installations and working with chargers is crucial.
- Training with drivers for economical driving is important.
- A tier-system training model developed by local community colleges and manufacturers can be useful.
Safety and Maintenance Training
- Require a comprehensive safety, operations and maintenance training program at the initial stage.
- Have six months between the commissioning date and the revenue service target date so that there is time to train operators, mechanics, general service people, supervisors and emergency service personnel in advance. After that, a yearly safety training should be conducted.
- Build project roadmaps and prepare comprehensive training plans.
- Use a progressive training model starting with technician training followed by operations training and then high-voltage safety training.
- Conduct safety trainings focused on flash hazards, PPE requirements and high-voltage training.
- Partner with manufacturers for maintenance training.
Education
- Partner with manufacturers for resources for training staff and contractors.
- Participate in conferences, webinars and working groups for training purpose.
- Offer in-person hands-on training and job shadowing.
- Partner with local educational institutions and maintain communication with manufacturers.
Staff Preparedness
CUTRIC recommends that comprehensive staff preparation, change management and training is crucial for this transition. Early safety training (six months before the transition) can make the process easier. Training on high-voltage systems, emergency services, project management, charger technology and software technology should be included. Though manufacturer training provides support, it is not always sufficient. Currently many technicians are hesitant to deal with high-voltage buses, and staff are concerned about training requirements.
As indicated throughout this report, a transition of this nature is a significant undertaking. Given the need to continue to provide service as scheduled while also learning and adapting to a new technology on a smaller fleet it is anticipated that a significant investment in human resources will be required to undertake this initiative. Most transit systems who have started this the transition to ZEBs have a dedicated team working solely on the implementation given the scope and nature of the steps involved. Costs associated with the additional resource requirements were not contemplated in the Commission’s 2023 Operating budget which was approved as part of the multi-year budget process.
Policy Landscape and Potential Funding Sources
To implement ZEBs, LTC requires significant amounts of financial, social and policy support from both federal and provincial governments.
Currently, the federal government is providing substantial funds in support of transit electrification. These funds are documented in the following section. In addition, the provincial government is opening a hydrogen strategy that may prove valuable in the future in offsetting the higher fueling costs associated with fuel cell buses today.
Federal policy has produced transit-oriented and, specifically, electrification-oriented funding programs in recent months. These include the following sets of funding sources:
- Zero Emission Transit Fund (ZETF): Starting in 2021, the Government of Canada is investing $2.75 billion over five years to support public transit and school bus Operators’ plans for electrification, support the purchase of 5,000 zero-emission buses and build supporting infrastructure, including charging infrastructure and facility upgrades.
- Strategic Science Fund: This fund aims to mobilize the expertise and resources of independent, third-party science and research organizations (TPOs) to enhance Canada’s science, technology and innovation (STI) excellence. ZEBs are potential sites for ongoing data analysis and performance evaluation of energy systems as well as greenhouse gas emissions reductions. LTC could leverage these funds in partnership with science and research organizations, such as CUTRIC, for ongoing and future research into ZEB performance on site and in situ.
- Clean Fuels Fund: An investment of $1.5 billion over five years to establish a clean fuels fund and to de-risk the capital investment required to build new or expand existing clean fuel production facilities. This funding program could support a deployment and testing pilot program allied to hydrogen fueling technologies or energy storage device integration studies as fueling production in the London area.
- Canada Infrastructure Bank Financing (Zero-Emission Buses Initiative): Originally a $1.5 billion initiative targeting the accelerated adoption of an estimated 4,000 ZEBs, comprising of a mix of transit and school buses, this program finances the cost differential for electric bus technologies over diesel bus infrastructure equivalents based on savings over diesel deployments and operations. This program is a low-risk financing program that London could leverage to support the financing of parts of its full fleet asset acquisitio
As set out in the report recommendation, administration will work in cooperation with civic administration to determine the most appropriate funding avenues to support both the initial ZEB procurement as well as the ongoing replacement costs associated with transitioning the fleet.
Initial Procurement
As set out in Staff Report #3 dated August 25, 2021, the Commission directed administration to continue discussions with CUTRIC with respect to LTC’s participation in a CUTRIC-led joint procurement (JPI) for a turn-key solution. This procurement would see the potential for multiple transit agencies participate in a procurement for both the bus and charging infrastructure, resulting in a turn-key solution for the initial rollout. There are numerous benefits to this approach, including but not limited to the following:
- facilitates knowledge and experience sharing among transit agencies;
- optimize resource utilization across participating transit agencies;
- leverages CUTRIC’s national network of transit agencies to share knowledge with respect to ZEB technologies and fill in knowledge gaps going forward;
- contributes to the development of a scalable and potentially reusable procurement template for future procurements for LTC as well as other transit agencies;
- turn-key approach provides the participating agencies with all of the required infrastructure to introduce ZEBs into the fleet, and results in the requirement for bus and charging equipment OEMs to work in tandem to ensure a smoother rollout; and
- incorporation of a data analytics requirement into the JPI will ensure that participating agencies are collecting data in a similar fashion, making it more useful for comparison purposes going forward.
Over the last number of months, work has continued on the joint procurement initiative, which has included the incorporation of Canadian Urban Transit ZEB Procurement Centre (CUTZEB) as a federal not-for-profit corporation, the sole member of which will be CUTRIC. The governance structure for CUTZEB will be an independent board, with representatives from transit agencies and/or associations who have experience with ZEB implementations as well as the President and C.E.O. of CUTRIC. The board will provide oversight and input to the Joint Procurement initiatives undertaken by CUTZEB. A Steering Committee will be formed for each procurement, made up of a representative from each of the transit agencies participating in the actual procurement. Each member of the Steering Committee will have one vote when selecting the winner of the RFP for the procurement. Once a winning bid has been confirmed, each of the participating agencies will establish contracts with the selected suppliers for their specific quantities of buses and charging infrastructure.
LTC administration does not currently have the expertise required to create the specifications for a charging infrastructure procurement, and as such, will need to participate in a joint initiative of this nature, or rely on outside contracted services to develop the requirements and procurement process. The estimated costs for London Transit to participate in the CUTZEB JPI is $80,000. It should be noted that this procurement has the potential to cover more than one year, and as such, LTC could include future year’s bus requirements in this procurement.
Administration has participated in a number of meetings with respect to the CUTZEB JPI and the preferred approach has been finalized. Based on timelines required for approvals and resource requirements for CUTZEB and participating transit agencies, the following high-level timeline has been drafted. It should be noted that this timeline is tentative and could be subject to shifts as the process is finalized.
Preliminary Timeline for the CUTZEB Joint Procurement
| Key Milestone | Tentative Date |
| Confirmation of participation by transit agencies | June/July 2022 |
| Completion of RFI Process | Sept 2022 |
| Release of RFP | Nov 2022 |
| Finalization of RFP – Contract Award | Mar 2023 |
Based on current delivery schedules, it can be expected that buses and charging infrastructure would be delivered no sooner than one year from the contract award. This delivery expectation is highly dependent upon the ability of the equipment manufactures to ramp up to deliver what is expected to be much higher quantity orders as applications for Federal funding are approved and systems move forward with purchases. The period between the contract award and receipt of equipment would be utilized to undertake any required facility upgrades/retrofits in preparation for the transition to ZEB technology as well as to undertake the required training for LTC staff that will be integral to the rollout.
Enclosure
I – CUTRIC Zero Emission Bus Fleet Implementation and Rollout Plan (Commissioners only)
Recommended by:
Craig Morneau, Director of Fleet & Facilities
Mike Gregor, Director of Finance
Katie Burns, Director of Planning
Joanne Galloway, Director of Human Resources
Concurred in by:
Kelly S. Paleczny, General Manager