Staff Report #2
March 15, 2022
To All Members of the Accessible Public Transit Service Advisory committee
Re: 2021 Conventional Transit Service Performance Report
Recommendation
The report be NOTED and FILED.
Background
The 2019-2022 Business Plan, London Transit’s vision is: “The valued and trusted mobility choice for Londoners”. The vision is supported by the mission statement, “Moving Londoners – progressively, reliably and affordably”. The vision and mission statements give direction to five congruent and competing strategic outcomes, namely:
- An integrated, affordable and valued mobility choice
- An engaged, diverse and respectful workplace
- Demonstrated fiscal accountability
- Being open, transparent and understood
- Effective utilization of infrastructure
Although not to the same extent as 2020, the year 2021 was also impacted by the ongoing pandemic. From the onset of the pandemic declaration, all levels of government made it clear that the continued delivery of public transit services was considered essential for communities to continue to function. In response, transit systems refocused priorities and directed efforts on ensuring the health and safety of their employees and their riders, ensuring to remain in lockstep with Provincial health directives and regulations. Notwithstanding these efforts, the pandemic impacted London Transit employees and resulted in decreased and fluctuating resource availability throughout 2021.
As indicated above, the current Business Plan includes key performance indicators for each year, which have been historically relied upon to measure the service performance against budget, targets, and previous years. While the data required to continue to monitor and report on these indicators was gathered throughout the pandemic period, the operating environment was drastically different from what would be considered normal, and as such, many of the indicators are not considered reliable for 2021 in terms of measuring service performance against budget or previous years. When 2021 budgets and related targets were finalized they included a forecasted increase in ridership as public health measures were anticipated to be lifted.
Pandemic Period Ridership As A Percent of Pre-Pandemic (2019) Levels
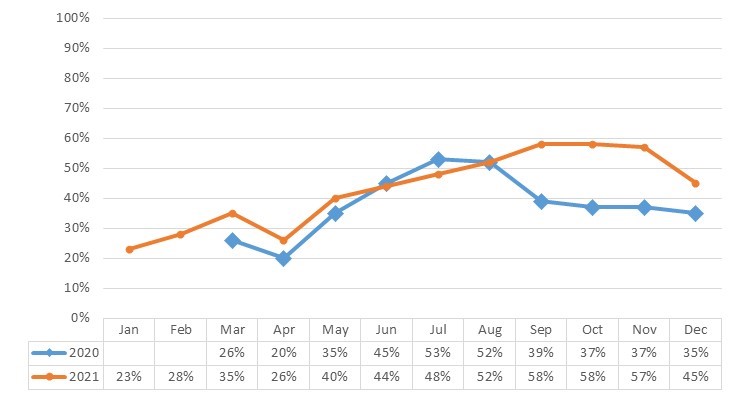
Unfortunately 2021 saw a third pandemic wave in the spring which resulted in a decline in ridership, and then the beginning of the fifth wave in December, which resulted in another significant dip. The fall of 2021 saw the return of post-secondary students to on-campus learning, which saw ridership levels climb back to the highest point since the onset of the pandemic.
Notwithstanding the impacts of the ongoing pandemic, the remainder of the report will provide the traditional year over year and actual to budget comparisons in the interest of transparency. Additional commentary will be provided with the indicators discussing the impacts of the pandemic.
Service performance is measured in terms of fiscal accountability (efficiency), service (effectiveness and quality), and communication (accuracy and quality of information provided).
Conventional Transit Service – Efficiency
The following table provides a summary of ridership and revenue service hours actual to budget performance for 2021 (unaudited).
2021 Ridership and Service Hours – Actual versus Budget
| Description | Actual | Budget | Percent Better (Worse) |
| Revenue service hours (millions) | 0.611 | 0.631 | (3.3)% |
| Ridership (millions) | 8.266 | 11.370 | (27.3)% |
| Rides per capita | 20.0 | 27.4 | (37.0)% |
| Rides per revenue service hour | 13.5 | 18.0 | (40.9)% |
| Service hours per capita | 1.5 | 1.5 | — % |
As indicated earlier in this report, given the pandemic impacts experienced throughout 2021, actual ridership performance was below what was budgeted; however service hours were in line with what was budgeted. The rides per service hour statistic demonstrates the impact of leaving higher levels of service in place than ridership would have traditionally warranted, noting buses were approximately 41% less-full system-wide than what was budgeted. The ability to maintain service levels notwithstanding the lower ridership helped ensure that physical distancing was possible for those customers who relied on public transit to get to and from essential work throughout the pandemic. Given this metric is based on a system-wide average, it is acknowledged that some bus routes continued to experience full loads, which were mitigated to the greatest extent possible through the addition of tripper buses where possible.
The following table provides comparisons in the various ridership and service hour measures over the past four years.
Ridership and Service Hour Comparisons – 2018 through 2021
| Description | 2018 | 2019 | 2020 | 2021 |
| Revenue service hours (millions) | 0.635 | 0.656 | 0.596 | 0.611 |
| Ridership (millions) | 23.746 | 24.600 | 12.681 | 8.266 |
| Rides per capita | 60.7 | 60.1 | 30.6 | 20.0 |
| Rides per revenue service hour | 37.4 | 37.8 | 21.3 | 13.5 |
| Service hours per capita | 1.7 | 1.6 | 1.4 | 1.5 |
As previously mentioned, while there is no real value in attempting to compare 2020 or 2021 to previous years, the numbers are provided for transparency purposes only.
Customer Satisfaction
Conventional transit service customers have participated in numerous Voice of the Customer surveys over the past number of years, with the last one being in December 2018. In 2019 the Voice of the Customer survey was put on hold to revisit the timing of the survey in an effort to ensure the responses align with service improvements. Given the Voice of Customer survey process takes place on-board the buses with a face to face interview, the pandemic has since resulted in the surveys being placed on hold in an effort to enable physical distancing and the safest ride possible. One of the underlying rationale for conducting the Voice of the Customer survey is to reach out to customers who may not be inclined to contact customer service with a complaint or compliment. Further, it is a known fact that a customer is more likely to contact an organization when they have had a poor experience versus a good one. The Voice of the Customer allows customers to rate each area of service on their perception of how it meets their needs.
The results of the last Voice of the Customer survey reflect the service in place until the fall of 2019, and are included throughout this report as a reference point to what expectations and perceptions were prior to the onset of the pandemic. This data will be a key consideration during the completion of the Rebuild phase of the Commission’s Pandemic Response Plan, noting it provides an indication of the state of the service as well as the priorities for improvements through the customer’s eye, prior to any pandemic related impacts.
Impressions of London Transit Service
This area of the Voice of the Customer survey measures satisfaction levels with LTC service including measures ranging from the convenience of the service to the cost of the service. The table below sets out the percent of survey respondents that agreed or strongly agreed with statements regarding the service for the 2018 survey.
Voice of the Customer Perceptions – 2018 Survey
| Service Statement | Agreed |
| Bus routes are conveniently located | 77% |
| There is enough seating on the bus | 64% |
| The service operates at the times I need it | 68% |
| The service operates on the days that I need it | 83% |
| Bus gets me to destination in reasonable time | 76% |
| Bus runs on time | 49% |
In addition to the Voice of the Customer surveys, customer satisfaction levels with service performance are measured through tracking both the number and nature of customer contacts received via email, social media, and phone. When considering these numbers, it is important to recognize that not all contacts are investigated and as such, have not been confirmed as an accurate characterization of the event. Contacts that are serious in nature or those in which the customer requests a response are each investigated.
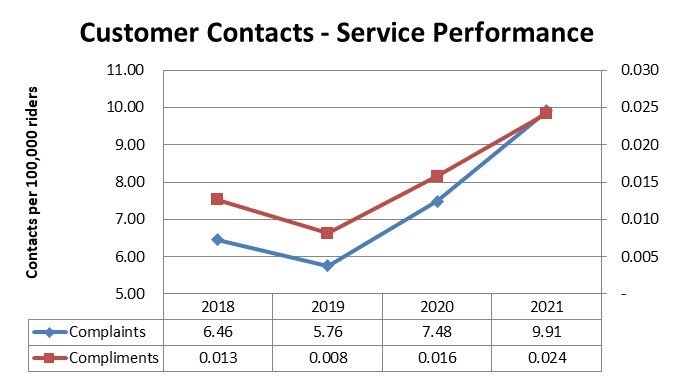
As set out in the following chart, service performance complaints expressed in terms of 100,000 riders had been trending downward since 2018. In 2020, the trend reversed, taking this measure back above the 2017 level, and extended even further in 2021. Of interest, the compliments, while much smaller in number, trended in an almost identical manner as the complaints. The charts below provide an overview of the total number of complaints and compliments as well as a breakdown of same by category which provides the opportunity for further analysis.
As important as the overall number of complaints received, is the nature of the complaints, all of which are analyzed to assess the impacts of the previous years’ service plan changes as well as to plan for future service changes. The table below sets out a breakdown of the number of service complaints over the four-year period by category, as well as a percentage change in each category over the period.
Total Service Performance Complaints by Category 2018-2021
| Complaints – Service | 2018 | 2019 | 2020 | 2021 | % Change |
| Detour/off route | 115 | 71 | 57 | 72 | (37)% |
| Early schedule | 106 | 81 | 62 | 69 | (35)% |
| Late schedule | 521 | 462 | 160 | 178 | (66)% |
| Missed passenger – drove by | 324 | 370 | 320 | 278 | (14)% |
| Missed passenger – not at stop | 375 | 341 | 241 | 182 | (51)% |
| Overcrowding | 58 | 55 | 88 | 15 | (74)% |
| Transfer connection | 34 | 36 | 21 | 25 | (26)% |
| Total | 1,533 | 1,416 | 949 | 819 | (47)% |
| Per 100,000 riders | 6.46 | 5.76 | 7.48 | 9.91 | 53 % |
While it is difficult to compare the total number of complaints received in 2020 and 2021 to previous years given the varying operating conditions relating to the pandemic, the total complaints per 100,000 riders provides a measure that can be compared. As indicated in the above table, while the total service performance complaints per rider had been steadily declining over since 2018, it climbed significantly in 2020 and again in 2021. The possible reasons for the increase as well as the shift in complaint categories is discussed further below.
While the historic top category of complaints over the two-year period 2018-2019 was “late schedule”, complaints of this nature were reduced by 66% in 2021. The reduced vehicular traffic coupled with reduced ridership both played a significant role in buses being better able to remain on schedule throughout 2021. While not specifically identified in the table, given bus schedules were not modified to reflect the reduced traffic and ridership, a number of contacts were received from riders angry that buses were sitting at stops for extended periods of time. These extended dwell times were required in order to ensure that buses remained on schedule and did not get ahead of schedule, which would result in riders missing the bus and having to wait for the next one.
The other factor that can impact service delivery is service interruptions stemming from vehicle breakdowns. The table below sets out the mean kilometers between service interruptions, further broken down between those requiring the bus to be changed off and returned to the garage and those that could be fixed on-route by the mobile mechanic. While both categories represent an inconvenience to customers and an interruption to service, those that can be addressed by the mobile mechanic on-route cause less of a disruption.
Mean KMs Between Service Interruptions – 2018-2021
| Description | 2018 | 2019 | 2020 | 2021 |
| Service pull-ins | 2,406 | 2,305 | 1,760 | 1,776 |
| Mean kms between pull ins | 5,359 | 5,810 | 6,774 | 7,199 |
| Year over year change | -1% | 7% | 8% | 6% |
| In-service repairs (mobile mechanic) | 3,053 | 3,158 | 2,887 | 2,993 |
| Mean kms between in-service repairs | 4,223 | 4,241 | 4,347 | 4,272 |
| Year over year change | -4% | 2% | -1.7% | -1.7% |
In-service repairs (road service calls) and service pull-ins have a negative impact on the quality of customer service e.g. schedule adherence. Such events are inherent in public transit operations given such factors as weather and road conditions, the constant start/stop nature of the operation and the increased complexity and sensitivity associated with bus systems and related ancillary equipment (e.g. Automatic Vehicle Location (AVL), electronic fare boxes, smart card equipment, etc.).
Service pull-ins, measured in terms of mean revenue kilometers between incidents has continued to improve over the four-year period. This category is the most disruptive of the two, as it requires customers to vacate the bus and transfer to a replacement bus. As such, efforts are made to identify the issues resulting in these instances, and equipping the mobile mechanic, where possible, to rectify these issues on road.
Impressions of Operator Performance
Another area of London Transit’s conventional service measured by the Voice of the Customer surveys covers Operator performance expectations. As set out in the table below, survey respondents indicated a high level of satisfaction with Operator performance as well as their knowledge of the system.
Voice of the Customer Perceptions
| Service Statement | 2018 |
| The bus is well driven | 89% |
| Bus drivers are helpful and courteous | 79% |
| Bus drivers are knowledgeable about the transit system | 86% |
Consistent with service related contacts, customer contacts (complaints and compliments) regarding Operator performance are also tracked and trended. Performance results for 2018 through 2021 with respect to Operator complaints are set out in the following table. When comparing the number of complaints from previous years, either in total or by category, it is important to remember that ridership and service levels also fluctuated significantly in 2020 and 2021. The total complaints per 100,000 kilometers provides a normalized indication of the trends in complaints year over year.
Total Operator Complaints by Category 2018-2021
| Complaints – Operator Performance | 2018 | 2019 | 2020 | 2021 | % Change |
| Speeding | 42 | 40 | 42 | 43 | 2 % |
| Unsafe manner | 445 | 426 | 232 | 253 | (43)% |
| Deadheaded | 21 | 23 | 9 | 1 | (95)% |
| Idling | 6 | 13 | 26 | 21 | 250% |
| Drive through red light | 27 | 45 | 21 | 23 | (15)% |
| Not stopping at stop sign | 17 | 16 | 17 | 8 | (53)% |
| Yield to Bus | 46 | 61 | 29 | 20 | (57)% |
| Quality of Ride | 53 | 54 | 34 | 19 | (64)% |
| Splashed Pedestrian | 10 | 10 | 5 | 6 | (40)% |
| Total Driving Related | 667 | 688 | 415 | 394 | (41)% |
| Attitude/Treatment | 607 | 651 | 588 | 361 | (41)% |
| Presentation | 59 | 47 | 62 | 56 | (5)% |
| Smoking | 16 | 8 | 13 | 4 | (75)% |
| Cell Phone | 27 | 26 | 17 | 14 | (48)% |
| Missed stop requested | 55 | 71 | 47 | 37 | (33)% |
| Total Service received | 764 | 803 | 727 | 472 | (38)% |
| Total | 1,431 | 1,491 | 1,142 | 866 | (39)% |
| Per 100,000 kilometres | 11.12 | 11.08 | 9.01 | 6.77 | (39)% |
As indicated in the table, in total, complaints in 2021 relating to Operator performance decreased over previous years, with the total Operator complaints per 100,000 kilometres decreasing by 39% over the four year period.
Driving related Operator complaints declined by 41% over the four year period, with decline in virtually every category. The makeup of complaints per category remained consistent over the period, notwithstanding the differing operating conditions in 2020 and 2021. While the number of complaints is not significant, as previously mentioned the increase in “idling” complaints is attributed to the increased need for buses to sit at stops longer than normal in order to remain on schedule (not early). The reduced vehicular traffic combined with reduced ridership resulted in the need for Operators to sit and wait at time points in order to ensure their bus did not get ahead of schedule.
Total complaints with respect to ‘service received from the Operator’ also decreased in 2021 to the lowest in the four-year horizon. The largest number of complaints in this category (representing approximately 83% of the total in 2021) relate to driver attitude and passenger treatment. Of note, in 2021, 420 of the 866 complaints in this category (approximately 48%), were classified as being directly related to the pandemic. Throughout the pandemic, public health guidance changed, resulting in the need to frequently change programs and protocols for public transit services in order to ensure both operators and passengers remained as safe as possible.
In the case of complaints alleging a significant Operator performance issue, an investigation is completed, which can include any or all of the following; interview with the Operator and complainant, assessment of AVLC data, review of the bus’ audio/visual system (noting there is a strict protocol for accessing the system recordings). It should be noted that contacts received from customers are based on the customer’s perception of the incident, and are not always consistent with what actually occurred. In all situations, when requested, a response regarding the assessment is provided to the customer who filed the contact.
Operator performance compliments are also tracked and trended. In 2021 overall Operator performance compliments were at the lowest over the four-year period with a decrease of 55% for same. The chart below sets out the trend in Operator compliments over the period of 2018 through 2021.
Total Operator Compliments by Category 2018-2021
| Operator Performance | 2018 | 2019 | 2020 | 2021 | % Change |
| Attitude/Treatment | 249 | 213 | 240 | 114 | (54)% |
| Presentation | 9 | 1 | 2 | 1 | (89)% |
| Total | 258 | 214 | 242 | 115 | (55)% |
| Per 100,000 riders | 1.09 | 0.87 | 1.91 | 1.39 | 28 % |
While the total number of compliments received over the four year period has remained somewhat consistent with the exception of 2021, the compliments per 100,000 riders in 2020 and again in 2021 were significantly higher than that of previous years. These expressions of gratitude were shared with employees through postings on internal screens and quoted in the employee newsletter. These messages were well-received and appreciated by all LTC employees who continued to do their part in ensuring the service continued to operate.
Impressions of Service Safety
As set out earlier in this report, 89% of respondents of the 2018 Voice of the Customer felt that LTC vehicles are operated in a safe manner. The tables below set out the total number of motor vehicle accident reports for each year for the period of 2018 through 2021.
Summary of Motor Vehicle Accidents – On Road 2018-2021
| Description | 2018 | 2019 | 2020 | 2021 |
| Number of reports | 359 | 369 | 293 | 315 |
| · Preventable | 175 | 152 | 143 | 149 |
| · Non-Preventable | 184 | 217 | 150 | 166 |
| Total per million km | 27.9 | 27.5 | 23.3 | 24.6 |
| Per 100,000 service hours | 56.5 | 56.3 | 49.2 | 51.6 |
| Mean km between reports | 34,082 | 34,882 | 42,835 | 40,589 |
| Year over year percent change | (19)% | 2% | 18% | (5)% |
Preventable motor vehicle accidents (MVAs) per service hour in 2021 increased slightly over 2020; however remained below traditional pre-pandemic numbers. In a breakdown of cause, ‘hit objects’ accounted for 25% of all MVC’s in 2021, with a large proportion resulting from the curbside mirror striking utility poles and bus stop plates. Placement of bus stop signs and bus shelters close to the curb can play a role in this, as such a full audit of all bus stop and shelter placements was conducted in 2021. Locations that were determined to be too close to the curb and could result in mirror strikes were moved back. Going forward monitoring of passenger side mirror strikes will continue and individual bus stops will be assessed as required. ‘Struck while stopped’ accounted for approximately 13% of the total MVAs in 2021. Incidents of this nature tend to occur in locations where roads and/or turning radius are tight which result in vehicles striking the bus while it is serving a stop (e.g. Oxford eastbound at Richmond where the bus bay is narrow and the roads are tight). MVAs are closely monitored and trended throughout the year, and communications programs are undertaken to provide Operators with quick tips for mitigating the most common causes. Additionally, Operators who have experienced multiple incidents are provided with refresher training targeting areas of concern.
Summary of Passenger Falls – 2018-2021
| Description | 2018 | 2019 | 2020 | 2021 |
| In motion | 23 | 26 | 14 | 27 |
| Stationary | 17 | 17 | 9 | 13 |
| Total | 40 | 43 | 23 | 40 |
| Per million km | 3.1 | 3.2 | 1.8 | 3.1 |
| Year over year percent change | (5)% | 3% | (43)% | 71% |
Passenger falls also decreased significantly in 2020 and then returned to typical numbers in 2021, noting that 2020 included several months of very low ridership when trips were limited for essential purposes only during the first wave of the pandemic.
The nature and extent of accidents/incidents are reflective of a number of factors including:
- changing and severity of weather conditions;
- increased road congestion and issues of road conditions; and
- heightened service and customer service expectations.
All passenger fall reports are reviewed, including, as warranted, accessing audio/visual system recordings to investigate the event, all of which is shared with the Commission’s adjuster and legal counsel. The management of accidents/incidents is critical to providing passengers with a safe trip as well as mitigating risk and liability. In terms of cost and risk, the vast majority of the reported accidents/incidents are minor in nature reflecting in part the broad definition of what constitutes an accident/incident.
Access to LTC Information
Customers and the public at large have a number of options to interact with London Transit. Those looking for dialogue, or some form of response, can use the customer service phone line or email. Given emails can be directed at any member of LTC administration, the total emails received and responded to are not tracked. Calls into the customer service department are tracked and trended against previous years’ experience. The table below sets out the total incoming calls to the customer service line in each of the years 2018 through 2021.
Summary of Customer Access – LTC Customer Service Line
| Description | 2018 | 2019 | 2020 | 2021 | % Change |
| Information line – answered calls(1) | 89,106 | 87,972 | 70,520 | 60,152 | (32.6)% |
| Interactive voice response(2) | 236,112 | 183,589 | 123,059 | 109,566 | (53.8)% |
| Calls per million rides | 0.014 | 0.011 | 0.015 | 0.020 | 49.4 % |
- Information Line statistics are for the hours of 6a.m. – 10p.m. Monday through Friday and 8:30a.m. – 4:30p.m. on weekends and statutory holidays. Service information provided by staff is based upon real-time information. Staff also assists with trip planning and answers other common questions.
- Interactive Voice Response (IVR) – IVR is a phone system that utilizes voice recognition technology to assist customers with providing real-time information by stop for conventional transit.
As indicated in the table, the total calls to both the information line and the interactive voice response declined in 2021; however, the calls per million rides indicate that the level of calls as a ratio of ridership climbed in 2020 and then again in 2021. Resource issues which resulted in fluctuating service levels during periods of 2021 likely played a role in the increased reliance on the customer service line by riders.
Customers and the public at large can also look to the LTC website for information about the service in general, or specifically to the Infoweb real-time for next bus information. In addition, a corporate Facebook page, which was established in late 2018, is maintained that provides news and updates relating to service.
In addition to the more-static information pages discussed above, a corporate Twitter account is utilized to provide updates with respect to service as well as to draw attention to specific information contained on the corporate website.
The table below sets out a summary of the visits to the LTC website, Infoweb real-time, corporate Facebook page and the total Twitter impressions from the corporate Twitter account for the years 2019 through 2021.
Summary of Customer Access – LTC Website
| Description | 2019 | 2020 | 2021 | % Change |
| Website – main site visits(1) (millions) | 1.647 | 1.024 | 0.870 | (47.2)% |
| Website – Infoweb real-time(1) (millions) | 0.518 | 0.324 | 0.318 | (38.6)% |
| Facebook visits | 0.072 | 0.151 | 0.060 | (16.7)% |
| Twitter Impressions(2) | 1.466 | 0.980 | 0.422 | (71.2)% |
| Site visits per million rides | 0.151 | 0.195 | 0.202 | 49.4 % |
- The numbers included in these items are based on Google Analytics, which measures sessions vs visits. A session is defined as the amount of time a user is actively engaged with the site, and all usage within that engagement is measured as one session.
- Twitter impressions represent a total of all the times Tweets originating from the corporate Twitter account have been seen. This includes times it appears in followers’ timelines, searches, or when a Tweet is liked.
Consistent with the calls to the information line, website visits, although down in number, have increased in terms of visits per million rides, indicating the continued reliance on this source of information for riders throughout the pandemic as procedures and service levels changed. The increase in the visits per rider could also be attributable to the approach of providing links to the website in corporate Tweets, which is discussed more thoroughly in the following section.
The following table provides an overview of the makeup of the various methods that customers and the public can utilize to find information with respect to public transit services. It should be noted that some information is limited to only one source (e.g. Commission agendas limited to corporate website), and as such, the addition of alternative methods of interaction may not directly impact others. The table below sets out the percent make-up of the various methods of interaction between LTC and the public at large.
Percent Make Up of Interaction Methods
| Percent Make Up | 2018 | 2019 | 2020 | 2021 |
| Information line – answered calls | 3.6% | 2.2% | 2.7% | 3.3% |
| Interactive voice response | 9.5% | 4.6% | 4.6% | 5.9% |
| Website – main site visits | 68.3% | 41.4% | 38.3% | 47.3% |
| Website – Infoweb real-time | 18.6% | 13.0% | 12.1% | 17.3% |
| Facebook page visits | 0.0% | 1.8% | 5.6% | 3.3% |
| Twitter Impressions | 0.0% | 36.9% | 36.7% | 22.9% |
| Total | 100.0% | 100.0% | 100.0% | 100.0% |
The use of the LTC website and Twitter continue to represent the majority of customer interactions with London Transit 2021. Google Transit trip planning and real-time information are also widely utilized; however, Google does not share visitor statistics with participating transit properties, so these numbers are not included in the above table.
In addition to the above access points, the LTC currently provides approximately 50,000 ride guides. The distribution of route schedules on board buses and at facilities continues to be on hold in an effort to limit the passing of paper that had been touched by multiple parities. Route schedules remain available on the LTC website in a printable format for those wishing a hard copy. Given the limited negative feedback with respect to this change, the permanent removal of paper schedules from buses and facilities is under consideration.
Going Forward
Feedback received in 2021 through the various methods discussed in this report will be utilized as input into the Rebuild phase of the Pandemic Response Plan, future Conventional Transit Service Plans and the 2023-2026 Business Plan. It is anticipated that a Voice of the Customer survey can be undertaken in 2022 which will also provide key customer insights for the aforementioned plans going forward.
Recommended by:
Lisa Hughes, Manager of Operations Administration
Caroline Roy, Manager of Corporate Communications
Patrick Cormier, Manager of Information Systems
Craig Morneau, Director of Fleet & Facilities
Concurred in by:
Kelly S. Paleczny, General Manager