Staff Report #2
June 26, 2019
To All Commissioners
Re: 2018 Ridership Assessment
Recommendation
That the report be NOTED and FILED.
Background
The fare structure employed by London Transit provides for four main categories of rider: cash, ticket, monthly pass and tuition pass. With the exception of the introduction of a fare increase or new fare programs, ridership fluctuations between fare categories tend to occur over a period of time, versus year over year. Given the significant number of changes to fare options over the past 18 months, the starting point for an assessment needs to be a review of the historic changes in London’s ridership in each of the categories. This analysis will establish a baseline for the assessment of the various factors impacting 2018 ridership.
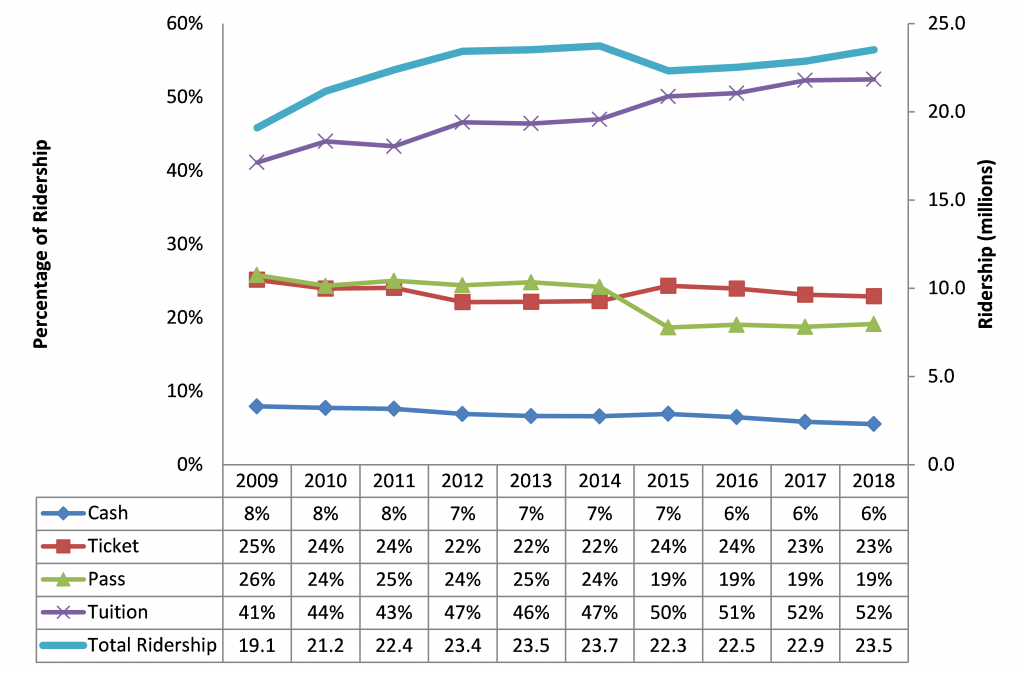
Over the ten year period 2009 through 2018, ridership grew by 23% (4.4 million rides) reaching 23.7 million rides in 2018. The following graph illustrates the overall trends in each of the fare categories over the past ten year period.
Ridership Trends by Fare Category – 2009 through 2018
Cash Riders
As the chart indicates, cash ridership has steadily declined over the period. Generally cash riders are considered the least captive, meaning they usually have alternative options for transportation, and utilize transit only when it suits them. Additionally, visitors from out of town who utilize public transit often pay with cash as a matter of convenience. While cash ridership provides the highest revenue, it is also the most costly to process, and as such, many transit agencies utilize pricing strategies to discourage the use of cash to pay for transit. The introduction of the stored value option on smart cards is anticipated to further reduce the percentage of riders that pay with cash. There have been no changes to fare categories or pricing over the period that would have resulted in the decline in cash riders, and as such, the decline is viewed as a natural progression of London’s transit riders away from this category.
Ticket Riders
As the chart indicates, ticket ridership as a percentage of total ridership has remained relatively static over the ten year period. Ticket riders are viewed as more captive than cash riders, but also as still having other options for their travel needs. Based on the adult fare category, a transit rider would need to ride the bus 43 times in a calendar month (approximately 1.4 times per day) to make a monthly pass a more economic option than tickets. As indicated earlier in this report, the launch of the stored value option on smart cards in early 2019 is anticipated to see an increase in “ticket” riders going forward, noting the amount deducted for a ride on the smart card is the equivalent of a ticket fare versus a cash fare.
Pass Riders
Monthly pass ridership held constant until 2015, when a change in the manner the transportation benefit component associated with Ontario Works was implemented. Prior to the change, the transportation benefit was provided as a monthly transit pass to all qualifying recipients of Ontario Works. In 2015, the program was changed to provide for a dollar allocation which can be utilized at the recipient’s discretion. This change resulted in a decline of approximately 1.4 million annual rides, all of which were included in the pass category. Subsequent to the change, the pass ridership as a percentage has remained static at 19%.
Pass riders are considered the most captive, in that, they have invested in a monthly pass that they intend to utilize to the extent necessary to get value for the dollars invested. The launch of the smart card program and the transition to allow monthly passes to be transferable between users has not negatively impacted the percentage of pass riders as originally anticipated. While fare pricing plays a role in the choice of fare category, the delivery of a frequent and reliable public transit service that meets the needs of more Londoners is the most effective way to shift riders to the monthly pass category.
Tuition Pass Riders
Tuition pass riders can also be considered captive, given they are provided with a transit pass that provides unlimited access to transit services for a 12 month period. While the graph indicates an increase in tuition pass riders as a percentage of riders beginning in 2015, this percentage increase is primarily related to the decline in pass riders as discussed above.
Tuition ridership is directly tied to enrollment at the participating institutions, both of which have experienced significant increases over the ten year period illustrated in the chart. The total number of students receiving an annual tuition pass in 2018 was 53,400, up 29% from the 41,400 students in 2009.
2018 Ridership Assessment
In preparation for the next multi-year budget cycle, the conventional transit ridership for 2018 was analyzed in an effort to determine trends as well as impacts from the various fare subsidy programs put in place in the recent past.
London Transit Ridership Comparison – 2018 vs 2017
| Ridership | 2017 | 2018 | Variance |
| Cash | 1,335,133 | 1,301,876 | -2.5% |
| Ticket | 5,288,666 | 5,384,201 | 1.8% |
| Monthly Pass | 4,341,616 | 4,732,020 | 9.0% |
| Tuition Pass | 11,956,128 | 12,327,971 | 3.1% |
| Total | 22,921,543 | 23,746,068 | 3.6% |
| Revenue | |||
| Cash | $3,671,615 | $3,508,159 | -4.5% |
| Ticket | 9,614,287 | 9,627,074 | 0.1% |
| Monthly Pass | 6,604,372 | 7,153,145 | 8.3% |
| Tuition Pass | 11,410,280 | 12,209,065 | 7.0% |
| Total | $31,300,554 | $32,497,443 | 3.8% |
As the table indicates, 2018 saw a 3.6% increase in ridership over the previous year, with the majority of the gains being experienced in the monthly and tuition pass categories. Direct, year over year comparison of the various ridership categories is not as straightforward an exercise for 2017 and 2018 as it has been in the past given the number of subsidized transit fare programs that have been implemented in the last 18 months. In order to better understand the overall trend, each of the new programs must be isolated and assessed on its own to determine the individual impacts each of the subsidized fare programs has had on ridership.
Free Transit for Children 12 and Under
The subsidy program providing for free transit trips for children 12 and under was launched January 1, 2017 in response to recommendations from the London For All – A Roadmap to End Poverty Report. Ridership for the program in 2017 was estimated, given the time required to get a mechanism in place to count the rides. Effective January 1, 2018, ridership was counted and reported via the smart card system, which requires each child to tap a fob on the smart card reader to record a ride. The table below sets out the ridership growth in the child category since the launch of the program.
London Transit Child Ridership 2016-2018
| 2016 | 2017 | Variance | 2018 | Variance | |
| Rides | 113,707 | 130,524 | 15% | 367,656 | 182% |
The 182% growth in child ridership in 2018 over 2017 demonstrates the success of this program with respect to increasing transit use for the 12 and under demographic. At the time the program was launched, it was anticipated that an ancillary benefit of the program may be increased adult transit ridership, given families may choose to go out and utilize transit more often when not paying a fare for children. A summary of the adult cash and ticket ridership over the same period is set out below.
London Transit Adult Cash & Ticket Ridership 2016-2018
| Adult | 2016 | 2017 | Variance | 2018 | Variance |
| Cash | 1,434,494 | 1,335,133 | -7% | 1,301,876 | -2% |
| Ticket | 3,895,665 | 3,768,208 | -3% | 4,107,757 | 9% |
| Total | 5,330,159 | 5,103,341 | -4% | 5,409,633 | 6% |
Any gains in adult ridership as the result of this program would have been expected to occur in the first year (2017). As the table above indicates, ridership in both the adult cash and ticket categories declined in 2017 as compared to 2016. The table does indicate a spike in adult ticket ridership in 2018 over 2017, however this is believed to be attributable to the cancellation of the subsidy for senior tickets and passes which became effective January 1, 2018, requiring riders in that demographic to transfer to the adult fare categories.
In summary, while the program has definitely resulted in an increase in ridership for the 12 and under demographic, there was no corresponding increase in adult ridership attributable to the program. For the most part, the increased ridership could be accommodated with existing resources, however a number of issues with respect to behaviour on-board have arisen which have required LTC Inspectors to address. An education campaign with respect to the expected behaviour while riding public transit is currently being developed which will be directed at this demographic.
Income-Related Transit Subsidy and Elimination of Seniors Discounts
The income related transit pass was the second transit related initiative from the London For All – A Roadmap to End Poverty Report recommendations to be approved by Municipal Council. This program provides for a monthly transit pass at a reduced rate ($52 vs $81) for any resident of London who meets the criteria (annual income below the defined LICO-AT threshold). The program application process was opened in late 2017 with the first discounted monthly passes being available January 1, 2018.
As part of the implementation of the income related transit subsidy program, the historical discount for seniors’ transit fares (25% discount from adult tickets or monthly passes) was eliminated. Given the multiple changes to the fare program were made concurrently, analyzing the impacts of each change on its own is not possible. The table below sets out the ridership impacts of each of the fare categories that would have been impacted by these programs.
Ridership Impacts of Income-Related Pass and Elimination of Seniors Discounts
| Ridership | 2017 | 2018 | Variance | |
| Adult Ticket | 3,768,208 | 4,107,757 | 339,549 | 9% |
| Senior Tickets | 445,104 | – | (445,104) | |
| 4,213,312 | 4,107,757 | (105,555) | -3% | |
| Citipass | 3,194,260 | 3,0070,654 | (123,606) | |
| Senior Pass | 335,338 | – | (335,338) | |
| Income Pass | – | 734,641 | 734,641 | |
| 3,529,598 | 3,805,295 | 275,697 | 8% | |
| Total | 7,742,910 | 7,913,052 | 170,142 | 2% |
Given there was no historical trend in increases in the adult ticket category, it is reasonable to determine that increases in this category in 2018 were directly attributed to the elimination of the senior ticket discount. Looking at the ticket category in isolation, the elimination of the seniors discount resulted in a loss of approximately 105,000 rides.
Applying the same logic to the pass category, the decline in the Citipass ridership can be attributed to the introduction of the income-related pass, indicating that existing transit riders historically purchasing a monthly Citipass and meeting the criteria for the new program began to take advantage of the income-related pass. It should be noted that the criteria for the income-related pass is applicable to any Londoner aged 18 and over, and as such, there was likely a transfer of some of the historic senior pass riders to the new income-related pass as well as the Citipass (for those who don’t meet the income criteria). As the table above indicates, in the pass categories, the ridership comparison indicates an overall increase of rides of approximately 275,700.
Another useful analysis of the impact of the income-related pass program is the assessment of the overall change in the three affected pass categories by month. The chart below provides the variance in monthly pass sales between 2017 and 2018.
Monthly Pass Sales Impacts – 2018 vs 2017
| Month | Citipass | Seniors | Income | Net Impact |
| Jan | (72) | (629) | 625 | (76) |
| Feb | (321) | (640) | 999 | 38 |
| Mar | (214) | (648) | 1,130 | 268 |
| Apr | (238) | (647) | 1,197 | 312 |
| May | (156) | (644) | 1,241 | 441 |
| Jun | (199) | (642) | 1,257 | 416 |
| Jul | (353) | (637) | 1,220 | 230 |
| Aug | 27 | (626) | 1,234 | 635 |
| Sep | (470) | (651) | 1,292 | 171 |
| Oct | (481) | (675) | 1,338 | 182 |
| Nov | (527) | (671) | 1,395 | 197 |
| Dec | (693) | (657) | 1,331 | (19) |
| Total | (3,697) | (7,767) | 14,259 | 2,795 |
As the table indicates, in 2018, there was a net additional 2,795 passes sold in the categories that would have been affected by the introduction of the income-related pass and elimination of the seniors discounted pass versus 2017.
In summary, the estimated net annual impact on ridership of the income-related pass introduction combined with the senior pass and ticket discount elimination is an increase of 170,142 annual rides.
Subsidized Youth Pass
In September 2018 a subsidy was approved by Municipal Council to provide for a reduced price pass for youth, defined as those aged 13 through 17. The monthly pass is offered at the same discounted rate as the income-related pass. Prior to the launch of this fare option, riders in this age category could choose to purchase a monthly Citipass or utilize student tickets (which are offered for $1.54 per ride vs $1.90 for an adult ticket). Impacts to ridership resulting from the introduction of this program would be in the student ticket, Citipass and Youth Pass categories. The table below sets out the change in ridership in each of these categories for the period September through December in both 2017 and 2018.
Ridership Comparisons – September through December
| Category | 2017 | 2018 | Variance | % Variance |
| Student Tickets | 346,592 | 298,456 | (48,136) | (14)% |
| Citipass | 1,102,923 | 1,026,891 | (76,032) | (7)% |
| Weekday Pass | 200,384 | 187,102 | (13,282) | (7)% |
| Youth Pass | 183,268 | 183,268 | ||
| Total | 1,649,899 | 1,695,717 | 45,818 |
Given the historic trend of increase experienced in the student ticket category, it is a fair assessment to attribute the entire decline in student tickets ridership in the fall of 2018 to the introduction of the discounted Youth Pass. The following table sets out the change in total pass sales in each of the pass categories being analyzed for the period September through December 2018 versus 2017.
Total Pass Sales Comparisons – September through December
| Category | 2017 | 2018 | Variance | % Variance |
| Citipass – Adjusted | 20,673 | 19,265 | (1,408) | (11)% |
| Weekday Pass | 4,900 | 4,563 | (337) | (7)% |
| Youth Pass | 0 | 3,377 | 3,377 | |
| Total | 25,573 | 26,442 | 1,632 | 6% |
The number of Citipasses sold has been adjusted in the table above to remove those believed to have been lost to the income-related pass from the equation (approximately 200 per month). The resulting assessment indicates that the introduction of the discounted Youth Pass resulted in an increase of pass sales of 1,632 over the four month period. The monthly rides required to be taken in order to make the monthly pass more cost-effective than student tickets is 34. Utilizing the total reduction in ticket riders over the period and the break-even of 34 rides, it can be estimated that the transfer of rides from the ticket category resulted in the purchase of approximately 1,400 Youth Passes. With the variances in all affected fare categories combined, the discounted Youth Pass program resulted in an approximate increase of 232 passes over the four month period, or an average of approximately 58 net new passes per month.
In summary, over the four month period in 2018 where the subsidized Youth Pass was available, it resulted in a net increase of an estimated 45,800 rides.
The following table provides a summary of the impacts on 2018 ridership from the 3 subsidized fare programs detailed above.
2018 Ridership Impacts From Subsidized Fare Programs
| Fare Category | Free Fare 12 and Under | Income Related Pass | Elimination of Senior Discounts | Youth Pass | Total |
| Ticket | |||||
| Adult | 339,549 | 339,549 | |||
| Student | (48,136) | (48,136) | |||
| Senior | (445,104) | (445,104) | |||
| Child | 367,656 | 367,656 | |||
| Passes | |||||
| Citipass | (123,606) | (76,032) | (199,638) | ||
| Weekday | (13,817) | (13,817) | |||
| Senior | (333,981) | (333,981) | |||
| Income-Related | 734,641 | 734,641 | |||
| Youth | 183,286 | 183,286 | |||
| Total | 367,656 | 611,035 | (439,536) | 45,301 | 584,456 |
| % of Increase | 63% | 29% | 8% | ||
As indicated in the table, the total impact of the three subsidized transit fare programs on 2018 ridership is estimated at an increase of 584,456 rides. What has not been taken into account in the above analysis is the overall trend in ridership growth that had been experienced prior to the introduction of these programs. Prior to 2018, and excluding the negative impact of the change in OW transit subsidies in 2015, ridership in the ticket and pass categories had been growing at an average rate of 0.5% per year. Given the continued improvements that have been made to the service as part of the annual service plan process, there is no reason to believe this level of growth wouldn’t have also occurred in 2018 without any changes to fare options. Removing the approximate 120,000 additional riders that could have been expected to occur in these categories in 2018 based on historic ridership trends, the estimated impact of the three programs on ridership is an increase of approximately 465,000 rides. As set out in the table below, the remainder of the growth in ridership occurred in the tuition pass category.
Overall Ridership Trends in 2018
The following table provides a breakdown of the ridership detail for each fare category discussed earlier in this report for 2017 and 2018. Further discussion on the changes in each of the major categories follows.
London Transit Ridership Comparison – 2018 vs 2017
| Ridership | 2017 | 2018 | Variance | % Variance |
| Cash | ||||
| Adult | 1,335,133 | 1,301,876 | (33,257) | (2.5)% |
| Tickets | ||||
| Adult | 3,768,208 | 4,107,757 | 339,549 | 9.0% |
| Student | 944,830 | 908,788 | (36,042) | (3.8)% |
| Senior | 445,104 | (445,104) | (100.0)% | |
| Child | 130,524 | 367,656 | 237,132 | 181.7% |
| 5,288,666 | 5,384,201 | 95,535 | 1.8% | |
| Passes | ||||
| Citipass | 3,194,260 | 3,001,433 | (192,827) | (6.0)% |
| Weekday Pass | 565,031 | 581,500 | 16,469 | 2.9% |
| Post-Secondary | 71,683 | 67,272 | (4,411) | (6.2)% |
| Seniors | 335,338 | (335,338) | (100.0)% | |
| Summer | 52,984 | 48,046 | (4,938) | (9.3)% |
| Blind | 70,020 | 68,526 | (1,494) | (2.1)% |
| Other | 52,300 | 47,334 | (4,966) | (9.5)% |
| Income-Related | 734,641 | 734,641 | 100.0% | |
| Youth | 183,268 | 183,268 | 100.0% | |
| 4,341,616 | 4,732,020 | 390,404 | 9.0% | |
| Tuition | ||||
| Western Undergrad | 6,708,989 | 6,739,791 | 30,802 | 0.5% |
| Western SOGS | 1,240,222 | 1,254,714 | 14,492 | 1.2% |
| Fanshawe | 4,006,917 | 4,333,466 | 326,549 | 8.1% |
| 11,956,128 | 12,327,971 | 371,843 | 3.1% | |
| Total | 22,921,543 | 23,746,068 | 824,525 | 3.6% |
Cash ridership was down slightly in 2018 as compared to 2017, which has been the trend over the past ten years. None of the new fare programs implemented were determined to have any impacts on the cash fare category and as such, this decline is considered to be a continuation of the ongoing trend with respect to cash fares.
The ticket category was assessed to have been impacted by all of the new fare programs as discussed earlier in this report. Giving consideration to the prior ten year trends, it is believed that, without the introduction of the free fare for children 12 and under, the income-related pass, the youth pass and the elimination of the senior ticket and pass categories, there would have been no discernable change in the overall ticket category in 2018 as compared to 2017.
The pass category was also assessed to have been impacted by two of the new fare programs as discussed earlier in this report. Giving consideration to the prior trends in this category remaining relatively static as a percentage of total ridership, it is believed that the growth in the pass category is a combination of ridership growth stemming from the income-related and youth pass programs as well as growth in ridership generally.
Ridership in the tuition pass category is directly tied to enrollment at the participating institutions. In 2018, Fanshawe College opened a second campus in the core, and as such, enrollment numbers increased, resulting in significant increase in students utilizing their tuition pass and associated transit ridership.
In summary, 2018 ridership grew by a total of 3.6% over 2017, with the growth being attributed to a combination of general ridership growth, the introduction of subsidized transit fare options and an increase in the number of students participating in the tuition pass programs. While service plans are directed at improving the transit service, which in-turn will attract new riders, going forward, in addition to annual service plan improvements, it will be important to give consideration to initiatives set out in the Ridership Growth Strategy in an effort to grow ridership at a higher rate.
Recommended by:
Mike Gregor, Director of Finance
Concurred in by:
Kelly S. Paleczny, General Manager