Staff Report #3
November 27, 2019
To All Commissioners
Re: 2020-2023 Operating Budget Update
Recommendation
The Commission:
- DIRECT administration to provide the estimated impacts on public transit services in London associated with a reduction in service levels to meet the City of London’s target of 1.5% increase over 2019 funding levels; and
- DIRECT administration to forward to civic administration for consideration in an effort to mitigate the increase in City of London funding on the base operating budget for 2020, the replacement of Provincial Gas Tax funding allocated to the Bus Replacement Program of $2.6 million with the increased revenues from the Federal Gas Tax, and allocate the $2.6 million to the 2020 operating budget for public transit, reducing the base budget increase in City of London funding to 7.4% from the current 15.1%;
Background
At the November 5, 2019 meeting, the City’s Strategic Priorities and Policy Committee agenda included a report with respect to the 2020-2023 multi-year budget. A number of motions were passed with respect to this report, the two relating to London Transit are set out below.
“the Civic Administration BE DIRECTED to engage with the City’s agencies, boards and commissions (ABC’s) who submitted draft budgets in excess of the budget targets provided to encourage them to submit potential opportunities for reductions, in accordance with the City’s format and timelines, and to be prepared to address the impacts of a reduction to their budget to achieve the budget target”
“the Civic Administration BE DIRECTED to work with the London Transit Commission to identify opportunities to replace City of London capital levy funding for LTC capital projects with non-property tax sources of financing such as the one-time doubling of the Federal Gas Tax Fund.”
As set out in Staff Report #3 dated August 28, 2019, the multi-year operating budget for public transit services requires a 20.6% increase in City of London funding in 2020 over that provided in 2019. The following table sets out the funding requirements for the total public transit services for 2020 in comparison to 2019 projected actual figures.
2020 Operating Budget Summary – Total Public Transit Services
| Funding Source (millions) | 2019 Projected Actual | 2020 Budget | Total Variance | % Variance | Unit price/Base Change | 2016-2019 Adjust | 2019 Flow Through | 2020 Growth | 2020-2023 Adds |
| Trans/Operating/Reserve Revenue | $ 36.014 | $ 40.061 | $ 4.047 | 11.2% | $ 0.292 | $ 3.322 | $ 0.285 | $0.148 | $ – |
| Provincial Gas Tax | 14.714 | 9.232 | (5.482) | -37.3% | 0.259 | (6.049) | 0.309 | – | – |
| City of London | 32.307 | 38.956 | 6.649 | 20.6% | 1.836 | 3.331 | 0.524 | 0.566 | 0.391 |
| $ 83.035 | $ 88.249 | $ 5.214 | 6.3% | $ 2.387 | $ 0.604 | $ 1.118 | $0.714 | $ 0.391 | |
| Investment Share | |||||||||
| Trans/Operating/Reserve Revenue | 43.4% | 45.4% | 2.0% | 4.7% | 5.6% | 63.7% | 5.5% | 2.8% | 0.0% |
| Provincial Gas Tax | 17.7% | 10.5% | -7.3% | -41.0% | 5.0% | -116.0% | 5.9% | 0.0% | 0.0% |
| City of London | 38.9% | 44.1% | 5.2% | 13.5% | 35.2% | 63.9% | 10.0% | 10.9% | 7.5% |
| 100.0% | 100.0% | 45.8% | 11.6% | 21.4% | 13.7% | 7.5% | |||
| Ridership (millions) | 24.271 | 24.648 | 0.377 | 1.6% |
The increase in City of London funding has been split between a base budget increase of 17.6% (based on 2019 status quo service levels) and assessment growth increase of 3.0% (new growth planned for 2020). The report that was tabled with the Strategic Priorities and Policy Committee on November 5, 2019 dealt only with the base budget requests.
As set out in both the Commission Staff Report #3 dated August.28, 2019 and the Strategic Priorities and Policy report dated November 5, 2019, the primary factor that led to the significant increase in City of London funding for 2020 is the cancellation of the planned doubling of the Provincial Gas Tax for Transit program by the current Provincial government. As was indicated in the budget report, (see Staff Report #3, dated August 28, 2019) reliance on Provincial Gas Tax over the previous four years far exceeded original projections for both conventional and specialized transit services, with the key contributing factors being two fare adjustment deferrals, specialized service contract increases relating to the Employment Standards Act changes regarding minimum wage, Operator recruitment criteria changes which led to increased recruitment and training requirements, general insurance program premium increases and bus engine issues. The budget report further states that, in an effort to mitigate, to the greatest extent possible, the increase in City of London funding required to return to a balanced budget in 2020, the budget presented included a fare increase in 2020 raising approximately $3.3 million in revenue, the optimization of Provincial Gas Tax allocations, expenditure control in all areas and a review of reserves and reserve funds.
Potential Budget Reductions and Impacts of Same – Conventional
As set out above, agencies, boards and commissions have been asked to identify potential budget reductions from the base budget originally submitted, and to include discussion on the impacts of same consistent with City of London reporting format and timelines. The deadline for submission of this information to civic administration is November 29, 2019.
When reviewing the following material, it is important to keep in mind that focus has been placed on the base budget request only (status quo with current service levels). For the purposes of this report, it is assumed that the draft service improvements as set out Staff Report #1, dated October 30, 2019 will not be implemented. The planned changes include the introduction of alternative service delivery to industrial areas as well as approximately 18,000 hours of service invested almost entirely in frequency improvements, the most notable being:
- Improvements to service in the industrial areas including the introduction of alternative service delivery into the Innovation Park industrial area as well as expanding service hour coverage in the Sovereign Road area;
- Significant frequency improvements on a number of routes in an effort to enhance overall service levels and eliminate 60 minute frequencies, the most significant of which are set out in the table below
2020 Draft Service Plan – Frequency Improvements
| Route | Area of City | Weekday | Weekend |
| 2 | East/Northwest | 33% | |
| 4 | South/East | 15% | |
| 10 | All | 50% | |
| 12 | South/West | 25% | 50% |
| 13 | South/North | 17% | |
| 17 | West/East | 25% | |
| 20 | East/West | 25% | |
| 25 | North/East | 33% | 60% |
| 27 | North/East/West | 9% | |
| 30 | South/East Industrial | 50% | |
| 31 | North/West | 33% | 40% |
| 34 | North/East | 33% | 33% |
| 106 | North/Core | 25% |
The following table breaks down the total operating budget requests for the conventional service by function in an effort to demonstrate where annual budgets are allocated and identify areas of possible reduction that would not negatively impact service levels.
Summary Allocation of Conventional Transit Operating Investment by Function
| Description | 2019 Proj | 2020 | 2021 | 2022 | 2023 |
| Transportation Services | 54.1% | 54.4% | 54.4% | 54.7% | 54.8% |
| Fuel | 9.5% | 9.5% | 9.4% | 9.5% | 9.5% |
| Vehicle Maintenance and Servicing | 21.6% | 21.7% | 21.6% | 21.5% | 21.4% |
| Total “on road” investment | 85.3% | 85.6% | 85.4% | 85.7% | 85.6% |
| Facility Maintenance | 6.4% | 6.5% | 6.5% | 6.4% | 6.2% |
| General and Administrative | 6.7% | 6.6% | 6.8% | 6.7% | 7.0% |
| Total Direct Operating Costs | 98.3% | 98.7% | 98.7% | 98.8% | 98.8% |
| Other | 1.7% | 1.3% | 1.3% | 1.2% | 1.2% |
| Total Operating Investment | 100.0% | 100.0% | 100.0% | 100.0% | 100.0% |
As the table indicates, there is little opportunity to reduce the budget ask without affecting service levels. An average of 85.6% of the annual conventional service operating budget is dedicated to on-road service (labour, fuel, fleet maintenance). The remainder of the budget calls for an average of 6.4% of total investment to be invested in maintaining the two facilities, and an average of 6.7% of total investment to be invested in general and administrative costs (all administrative and management positions).
London Transit has been considered a leader with respect to service efficiency among its peers for a number of years. The table below provides a comparator of expenditure breakdown with the peer group average from the 2017 Canadian Urban Transit Association statistics.
| London | Peer Group Average | |
| Transportation Services | 54% | 58% |
| Fuel | 9% | 9% |
| Vehicle Maintenance | 22% | 16% |
| Total On-Road Investment | 85% | 83% |
| Facility Maintenance | 5% | 5% |
| General & Administrative | 7% | 8% |
| Total Direct Operating | 98% | 96% |
| Other | 2% | 4% |
| Total Operating Investment | 100% | 100% |
As the table indicates, London Transit continues to outperform the peer group with respect to on-road investment as well as the total direct operating investment.
In an effort to provide an estimated order of magnitude with respect to the budget reductions required for the 2020 operating budget to meet the City of London established target of a 1.5% increase in City of London funding over the 2019 levels, a high level estimate was completed. In order to meet the 1.5% target, the total conventional transit operating budget would need to be reduced by $4.6 million, with the corresponding City of London annual investment being reduced by approximately $2.4 million. Taking into account the loss of ridership (estimated at approximately 1.5 million) and related revenue as well as the corresponding loss of Provincial Gas Tax revenues, it is estimated that approximately 62,000 annual hours of service would need to be eliminated in addition to an approximate $0.5 million in cuts to the general and administrative budgets.
The conventional service operating budget is supported by three primary sources of funding; revenue from fares, provincial gas tax contributions and City of London investment. History has proven that reductions to transit service levels need to be undertaken in a strategic manner in order to maintain a service that is attractive to as many of the existing riders as possible, thus minimizing the negative impacts on ridership (and related revenue).
The diagram below provides an overview of the approach and outcomes that were undertaken in the early 1990’s when Provincial funding for public transit was eliminated.
Spiral Effect of Service Cuts and Fare Increases 1990-1997
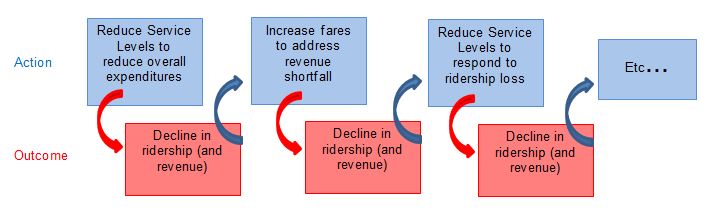
Over the seven year period 1990-1997, service hours were reduced by 17% and fares were increased by 46%, which resulted in a corresponding decrease in ridership of 32% and a decrease of 18% in total employee complement. Subsequent to this period of decline, investment levels in public transit services were slowly increased, however it was not until 2006 that ridership levels returned to the 1990 level.
There were many lessons learned over this period of decline, all of which have been incorporated into Business and Financial Plans going forward in an effort to ensure good value for investment while at the same time growing ridership by increasing service levels on existing routes as well as expanding to new areas. Some of the key initiatives that have been incorporated into plans include:
- the establishment and continuation of a multi-year Business Plan and related process in 1994 which sets out the strategic and tactical direction for the LTC and an iterative process to attain this direction through annual budgets, work plans and reporting;
- the establishment of a Financial Plan and related Fare Policy which balances the need to generate revenue with the customer’s ability and desire to pay;
- the establishment of annual key performance indicators which provide the ability to monitor and respond to issues in a timely manner;
- the establishment of a Performance Review Management (PRM) program, which calls for targeted and detailed reviews in selected service areas each year in an effort to identify efficiencies and ensure that resources are being allocated accordingly;
- the establishment of an administrative guideline regarding the use of the annual Provincial Gas Tax (PGT) allocations, requiring that a minimum of 1.5 years of PGT allocations remain in the PGT reserve to provide a short-term source of funding in the event that other sources are reduced. This guideline was established in effort to avoid the experience of the 1990’s and allow for a planned and measured approach to service reductions relating to a decrease in available investment;
- the establishment of 5 Year Service Plans which provide overall direction for service growth and accompanying annual service planning process which includes detailed analysis of the performance of current service in place; and
- the establishment of productivity standards (minimum boardings per hour) for each type of service that coincides with the financial plan.
Notwithstanding the aforementioned initiatives, the 15% fare increase scheduled for January 1, 2020 represents the first opportunity for reduced ridership. Coupling this with a significant service reduction has the potential to set off the spiral effect experienced in the 1990’s, which would be devastating to the transit system.
In an effort to ensure the best return on investment, while at the same time balancing the budget, service parameters have been established for each type of service provided, as set out in the table below.
Productivity Standards – Minimum Boardings per Revenue Service Hour
| Service Type | Weekday Peak | Weekday Evenings | Saturday | Sunday/Stat |
| Base Arterial | 50 | 30 | 30 | 20 |
| Minor Arterial | 25 | 20 | 20 | 15 |
| Local | 20 | 15 | 15 | 15 |
| Industrial | 15 | 15 | 15 | 15 |
| Express | 30 | |||
| Community | 15 |
The varying ridership levels on each type of service recognizes the social aspect of public transit services, acknowledging that there will be areas of the city that need service in order to provide access to as many Londoners as possible, but that won’t attract the same level of ridership as those areas where denser population results in much higher ridership. Each year, as part of the annual service planning process, all existing routes are assessed against these parameters, and those that are not meeting established targets are subject to change/elimination.
In order to continue to ensure the best return on investment and mitigate, to the extent possible, negative impacts on ridership, should the City of London investment for the 2020 base budget be something less than requested, routes and related levels of service would be reviewed to determine the poorest performing in terms of ridership compared to the service standards. These routes would see either service reductions or elimination depending on the order of magnitude of the budget shortfall. Over the last number of years, efforts have been directed at expanding service to areas of the city that had previously been under-served or not served at all by transit. Consistent with these steps, the next Five Year Service Plan Framework calls for the introduction of an alternative delivery service model to serve identified industrial areas of the city that are typically difficult to serve by a traditional transit route given the limited ridership. As noted in the table above, the draft 2020 Service Plan calls for frequency improvements in every area of the city. Given there are currently no routes in place that are not meeting the established guidelines for ridership as set out above, routes with the lowest ridership would be the first to be reduced/eliminated. This approach is consistent with the business principle that, in order to get maximum return on investment, resources should be focused on the areas with the best performance. When a business identifies the need to downsize, the poorest performers are the first to be eliminated.
The following map provides an illustration of the order of magnitude impacts on the conventional transit system should the base budget request be limited to a 1.5% increase over 2019 levels. The red represents the areas of the city that currently have conventional transit that will be eliminated and the pink represents areas that would see service frequency reductions.
Illustration of Estimated Impacts of Service Hour Reduction
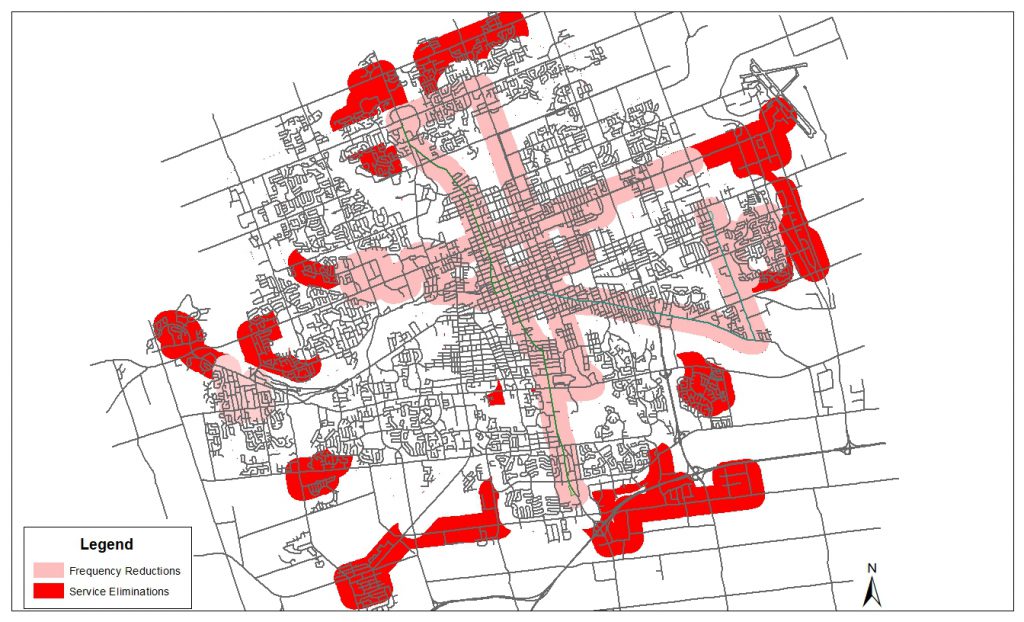
As the graphic illustrates, services on the periphery of the City would be the first to be eliminated based on the ridership generated on the routes serving those areas, and additionally, services in a number of areas would also see reduced frequencies. Should a decision be made to protect the services on the periphery, significant reductions in frequencies would be required on much of the remaining services, noting reductions in these areas will have a greater ridership loss associated with them given the current higher ridership levels and the undesirability of a less frequent service.
In terms of the impacts that will be associated with reductions of this nature to the conventional transit service, the following high-level impact statements will be included in the business case to Municipal Council:
- no frequency improvements as set out in the draft 2020 service plan (addition of 18,000 hours primarily targeted to improve frequencies throughout the system)
- no expansion bus purchases for 2020 as funded by the Investing in Canada Infrastructure Program – Transit Stream
- no alternative service delivery to industrial areas as set out in the draft 2020 service plan
- elimination of 62,000 hours of service, which will have the corresponding results of:
- services in the peripheral areas of the city being eliminated and frequencies being reduced in other areas of the city (see map);
- a loss of an estimated 1.5 million rides;
- a reduction of approximately 40 full-time equivalent positions; and
- a decrease in annual Provincial Gas Tax revenues associated with the ridership loss of approximately $0.630 million
Potential Budget Reductions and Impacts of Same – Specialized
The following table breaks down the total operating budget requests for the specialized service by function in an effort to demonstrate where annual budgets are allocated.
Summary Allocation of Specialized Transit Operating Investment by Function
| Description | 2019 Proj | 2020 | 2021 | 2022 | 2023 |
| Brokerage Operation | 13.5% | 12.5% | 11.6% | 11.7% | 11.4% |
| Contract Service Delivery Costs | 85.4% | 85.6% | 86.7% | 86.6% | 86.9% |
| Total “on road” investment | 98.9% | 98.1% | 98.3% | 98.3% | 98.4% |
| General and Administrative | 1.1% | 1.9% | 1.7% | 1.7% | 1.6% |
| Total Direct Operating Costs | 100.0% | 100.0% | 100.0% | 100.0% | 100.0% |
As the table indicates, there is very limited opportunity to reduce the specialized budget without impacting service, primarily due to the manner in which the service is delivered.
In an effort to provide an estimated order of magnitude with respect to the budget reductions required for the 2020 operating budget to meet the City of London’s established target of a 1.5% increase in City of London funding over the 2019 levels, a high level estimate was completed. In order to meet the 1.5% target, the total specialized transit operating budget would need to be reduced by $2.4 million, with the corresponding City of London annual investment being reduced by approximately $2.2 million. In terms of the impacts that will be associated with reductions of this nature to the specialized transit service, the following high-level impact statements will be included in the business case to Municipal Council:
- no service level improvements as set out in the draft 2020 plan which called for the addition of 6,000 annual service hours
- the reduction of approximately 38,000 service hours, which will have the corresponding results of:
- the provision of an estimated 95,000 fewer annual rides on the specialized transit service
- the rides per registrant dropping to 25.8 from 34.9 (26% reduction in access to trips)
- the annual non-accommodated trip rate increasing to 29% from the current 4%
- a decrease in annual Provincial Gas Tax revenues associated with the ridership loss of approximately $0.042 million
Options Relating to Capital Program Funding Sources
As set out in the report recommendation, an option for reducing the City of London investment share on the operating budget has been identified by review of the funding sources associated with the capital budget program. The table below sets out the funding makeup of the Bus Replacement Program for 2020.
2020 Bus Replacement Program
| Description | Units | 2020 Budget Amount | Amended Cost | Variance |
| Bus Replacement (40’) | 16 | $ 9,488,000 | $ 9,424,918 | $ (63,082) |
| Funding | ||||
| Provincial Gas Tax | $ 2,620,300 | $ 2,557,218 | $ (63,082) | |
| City of London | 5,367,700 | 5,367,700 | ||
| Federal Gas Tax – C/L | 1,500,000 | 1,500,000 | ||
| Total | $ 9,488,000 | $ 9,424,918 | $ (63,082) |
As the table illustrates, $2.6 million in PGT funding has been allocated to the Bus Replacement Program, with the remainder being funded by the City of London and Federal Gas Tax revenues allocated by the City of London. Earlier in 2019, the Federal Government announced a one-time doubling of the annual Federal Gas Tax revenues to be distributed to municipalities to assist with infrastructure spending.
Consistent with the motion adopted by Municipal Council with respect to identifying opportunities to replace City of London capital levy funding for LTC capital projects with non-property tax sources of financing such as the one-time doubling of the Federal Gas Tax Fund provides an opportunity within the Bus Replacement Program. The replacement of the Provincial Gas Tax funding of $2.6 million allocated to this project with the increased revenues from the Federal Gas Tax, provides the opportunity to allocated the PGT dollars ($2.6 million) to the 2020 operating budget for public transit, reducing the base budget increase in City of London funding for conventional transit services to 7.4% from the current 15.1%.
As set out in the report recommendations, the information contained in this report will be compiled into the City of London format and submitted to civic administration by the November 29, 2019 deadline.
Recommended by:
Mike Gregor, Director of Finance
Concurred in by:
Kelly S. Paleczny, General Manager