Staff Report #3
January 26, 2022
To All Commissioners
Re: COVID-19 Ridership Impacts
Recommendation
The report be NOTED and FILED.
Background
As set out in the Commission’s 2020 Annual Report, the pandemic declaration in March of 2020 and associated lockdown measures that followed resulted in a significant decline in transit ridership on both the conventional and specialized services. Each new wave of the pandemic resulted in varying levels of public health measures, including lockdowns in some cases. While there were some limited capacity restrictions in place during the month of December 2021, the next phase of “lockdowns” which included school closures as well as other closures and capacity restrictions took effect on January 5, 2022. Given this latest wave looks like it will extend into the first quarter of 2022, this report will continue being updated and presented as part of the monthly updates on the Commission agenda.
Conventional Transit Ridership
The organizational philosophy adopted at the onset of the pandemic with respect to service levels was to ensure that all areas of the city that were served by transit would continue to be served, albeit at lesser frequencies based on employee resource availability.
The graph below provides an overview of the ridership levels on the conventional service for 2021 and 2022 to date with comparative data for 2020, both as a percentage of what would normally be expected in each month noting the numbers are based on actual boardings as counted by the automatic passenger counters on buses. The bars are coloured to match the Provincial colour schemes associated with the various stages of lockdown as noted below:
Green Prevent – no, very limited restrictions in place
Yellow Protect & Stage 3 under the current re-opening plan – very limited restrictions in place
Orange Restrict & Stage 2 under the current re-opening plan – limited restrictions in place
Red Control & Stage 1 under the current re-opening plan – numerous restrictions in place
Grey Lockdown – full lockdown restrictions in place
The colour blue in the graphic is used for January and February 2020 given the pandemic declaration had not occurred at that point in time. Bars that are striped indicate a change during the month from the base colour to the striped colour.
2020, 2021 and 2022 Conventional Transit Ridership as a Percentage of Normal
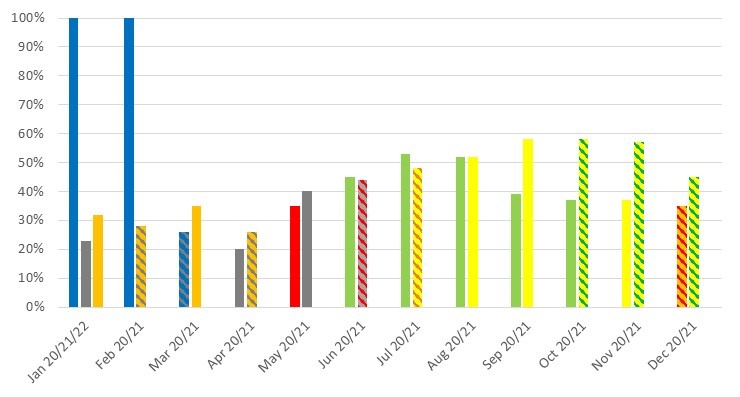
The conventional transit service has been operating at approximately 90% of normal service hours for each service period since September 2020. In early December, due to resource issues, a number of reductions in service were introduced to provide for a more reliable service overall and avoid daily run cancellations often made at the last minute. Effective December 6, 2021, Routes 102, 104 and 106 ceased operating on weekdays and effective December 11, 2021 Routes 90 and 91 ceased operating on weekends only. These reductions were selected given the cancelled routes operate on corridors where other routes also operate, ensuring that public transit service would be maintained on all corridors, though at a lesser frequency.
In late December, both Western and Fanshawe returned to online learning. At time of report writing, the plan is for Western to return to campus for some students at the end of January with the remaining students at the end of February, while the majority of Fanshawe students are anticipated to remain online through April. As such, ridership will be closely monitored on the routes serving the Western Campus in February, and routes 102 and 106 will be prioritized for resumption of service should ridership warrant and resources allow. Given the limited number of Fanshawe students anticipated to be on campus the need for Route 104 to resume prior to April is unlikely. The weekend service on Routes 90 and 91 will also be reinstated as soon as employee resource levels have returned to a level that can ensure the service requirements can be met on a regular basis.
The earlier graph clearly depicts the impacts that the various stages of lockdown have on conventional transit service ridership. As indicated in the graph, ridership for December 2021 and January 2022 declined from the previous three months, most likely related to the beginning of the latest pandemic wave and the transition to exams and then on-line learning at the post-secondary institutions, followed by the return to Stage 2 lockdown measures in early January.
The fall of 2021 also saw the beginning of a return to normal fare category makeup percentages, as depicted in the graph below.
Fare Category Makeup 2021 – As compared to Baseline Data
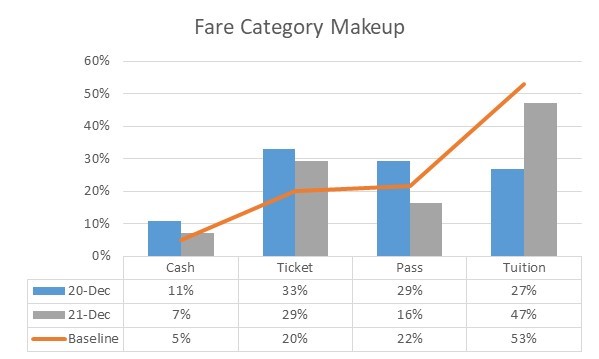
As referenced in the baseline make-up (orange line on the graph), pre-pandemic fare category make-up saw the majority of riders in the tuition and pass categories, with ticket and cash riders making up only 25% of total ridership. For the majority of 2020, as referenced in the December 2020 bars, cash and ticket ridership was significantly higher than baseline data, making up approximately 36% of ridership, while tuition ridership was approximately half of the baseline comparison. These shifts are directly tied to the nature of conventional transit ridership that occurred throughout 2020, which was more heavily weighted by employees who worked in sectors that were deemed essential. Further, given the ongoing changes to public health measures throughout 2020, many riders opted to utilize cash and ticket fares versus purchasing a pass that they may not require for the entire month. The shift away from tuition pass makeup ties directly to the online nature of classes at post-secondary institutions in 2020, and the limited number of students who were required to interact with campus on a regular basis.
As indicated earlier in this report, the fall of 2021 saw the beginning signs of a return to a more traditional fare category make-up as referenced in the December 2021 bar in the graph. With both Western and Fanshawe moving back to in-class learning in the fall of 2021, ridership in the tuition category returned to close to baseline levels. While the cash and ticket categories continued to remain higher than the baseline, the decline toward the baseline is clear. Given the return to online learning in late 2021, with a phased return to in-class, trends are likely to revert to those experienced in late 2020 for the next several months.
Specialized Transit Ridership
The graph below provides an overview of the ridership levels on the specialized service for 2021 and 2022 to date, with comparative data for 2020 as a percentage of what would normally be expected in each month. Consistent with the earlier graph, the colours in the various bars are reflective of the stages of lockdown that were in place at the time.
2020, 2021 and 2022 Specialized Transit Ridership as a Percent of Normal
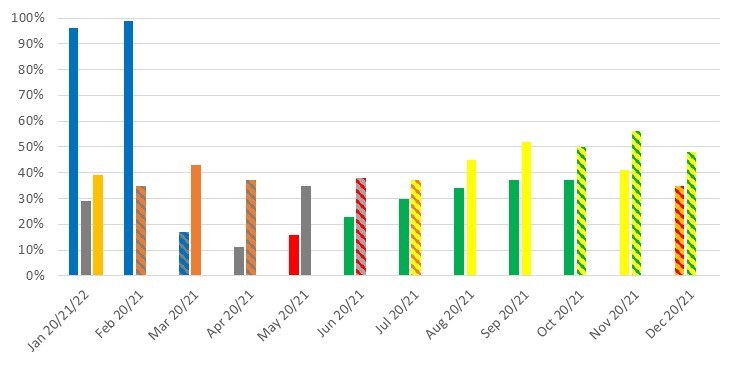
Consistent with the trend on the conventional service, specialized transit ridership also began to climb in September, and reached the highest level since the onset of the pandemic in November. A number of the group activities that traditionally operate in the fall had recommenced, which resulted in an increased demand for services. Beginning in early September, service hours on Sunday were increased in response to increased demand, and in October, evening services on Tuesday and Wednesday were increased to accommodate programs. Demand for service dropped off in late December and through January given the onset of the latest pandemic wave and newly implemented public health measures, which has included the temporary suspension of the aforementioned group activities. Administration will continue to monitor trip demand by time of day and day of week, and gradually increase service hours to meet demand.
Recommended by:
Katie Burns, Director of Planning
Mike Gregor, Director of Finance
Concurred in by:
Kelly S. Paleczny, General Manager