Staff Report #3
May 26, 2021
To All Commissioners
Re: COVID-19 Ridership Impacts
Recommendation
The report be NOTED and FILED.
Background
As set out in the Commission’s 2020 Annual Report, the pandemic declaration in March of 2020 and associated lockdown measures that followed resulted in a significant decline in transit ridership on both the conventional and specialized services. Late in 2020, the second wave of the pandemic resulted in public health measures including lockdowns which extended into the first part of 2021, and again in April of 2021 the third wave resulted in lockdowns that remain in place.
Conventional Transit Ridership
The organizational philosophy adopted at the onset of the pandemic with respect to service levels was to ensure that all areas of the city that were served by transit would continue to be served, albeit at lesser frequencies based on employee resource availability. The conventional transit service has been operating at approximately 90% of normal service hours for each service period since September 2020. This is anticipated to continue through the summer of 2021.
The graph below provides an overview of the ridership levels on the conventional service for 2021 with comparative data for 2020, both as a percentage of what would normally be expected in each month noting the numbers are based on actual boardings as counted by the automatic passenger counters on buses. The bars are coloured to match the Provincial colour schemes associated with the various stages of lockdown as noted below:
Green Prevent – no, very limited restrictions in place
Yellow Protect – very limited restrictions in place
Orange Restrict – limited restrictions in place
Red Control – numerous restrictions in place
Grey Lockdown – full lockdown restrictions in place
The colour blue in the graphic is used for January and February 2020 given the pandemic declaration had not occurred at that point in time. Bars that are striped indicate a change during the month from the base colour to the striped colour.
2020 and 2021 Conventional Transit Ridership as a Percentage of Normal
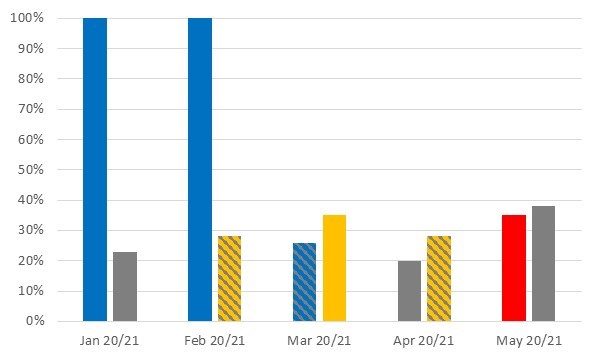
The graph clearly depicts the impacts that the various stages of lockdown have on conventional transit service ridership. Of interest, the data for May indicates higher ridership for May 2021 when under a full lockdown than what was experienced in May 2020 when London was in the Red-Restrict phase. Ridership for May 2021 while in full lockdown is also higher than that experienced in both March and April of 2020 during the initial lockdown period. This is in part indicative of the more lenient closures associated with what is considered an essential business during the 2021 lockdown than that which was in place in March 2020, resulting in more people travelling to/from work. Further, the higher ridership in each of months March through May in 2021 clearly demonstrates that the provision of free access to transit in 2020 did not result in a “bump” in ridership of those that traditionally would not utilize public transit.
With the spring service levels now in place, a number of routes have experienced increased passenger loads. Articulated buses will be assigned to these routes where possible in an effort to address the crowding conditions. Employee resources that would typically be utilized to assign trippers to the affected routes are limited at this time due to the ongoing pandemic and related restrictions. This situation is monitored on a daily basis, and in the case where employees are available, tripper buses will be added to relieve pressure on the routes experiencing the heaviest loads.
Ridership data for 2020 cannot be broken down by fare category given fares were waived from March to August of 2020. The chart below provides a breakdown of the ridership by fare category for 2021 and provides the historic breakdown for 2019 (full pandemic-free year) as a comparison.
Conventional Ridership by Fare Category
| 2019 (Normal) | Fare Category | Jan 2021 | Feb 2021 | Mar 2021 | Apr 2021 |
| 5% | Cash | 12% | 11% | 10% | 10% |
| 20% | Ticket/Stored Value | 39% | 42% | 41% | 40% |
| 22% | Monthly Pass | 23% | 22% | 21% | 25% |
| 53% | Tuition Pass | 26% | 26% | 28% | 25% |
| 100% | Total | 100% | 100% | 100% | 100% |
The shifts in fare category usage from normal (2019) to 2021 provide insight into the manner in which riders are currently utilizing public transit. Both the cash and ticket/stored value fare category usage have doubled in terms of makeup in 2021 as compared to 2019. This is indicative of riders who are unsure of how often they will be utilizing the service. This shift is likely due in part to the continued uncertainty with respect to public health measures, noting that these two categories provide the rider with flexibility. The monthly pass category has, conversely, remained consistent with 2019, indicating that approximately 25% of ridership is made up of riders that will utilize the service frequently enough in a month to make the monthly pass a better value, these riders tend to be those relying on the service to get to/from work or school. The decline in the tuition pass category make-up is consistent with the decline in the number of students participating in the programs given the shift to online learning as the result of the pandemic.
These trends will continue to be monitored throughout 2021 in an effort to identify the shifts in fare category make-up and ensure that campaigns designed to regain riders post-pandemic is targeted at the appropriate category of rider.
Specialized Transit Ridership
Specialized services continue to operate at a level that will accommodate all trip requests with a maximum of two passengers per vehicle. This has been achievable primarily due to the decline in demand for the service throughout the pandemic period. Given trips on the specialized service are pre-booked, service can be adjusted in response to demand.
The graph below provides an overview of the ridership levels on the specialized service for 2021, with comparative data for 2020, both as a percentage of what would normally be expected in each month. Consistent with the earlier graph, the colours in the various bars are reflective of the stages of lockdown that were in place at the time.
2020 and 2021 Specialized Transit Ridership as a Percent of Normal
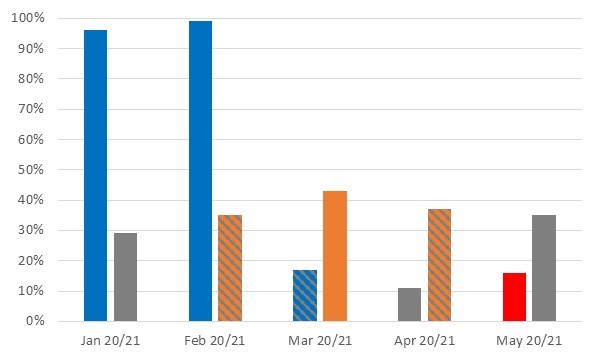
Specialized ridership in 2021 has doubled that of 2020 in the months that were impacted by the pandemic. The ridership increases on this service are also believed to be tied to the more lenient closures during the 2021 lockdowns, with more businesses remaining open for curbside pick-up. Anecdotally, based on discussions during the trip booking process, more riders are accessing the service for essential trips (i.e. groceries, medication etc.) in 2021, where in 2020 they avoided going out and rather relied on other options to obtain necessities. This is indicative of society at large feeling the need to be out in the community when possible to avoid the feeling of isolation that has set in as the pandemic period has dragged on.
Ridership levels and trends will continue to be monitored closely throughout the remainder of 2021 noting estimates for ridership and related revenue in 2022 will be a significant component of the 2022 operating budget. While COVID-relief funding has been available in 2020 and 2021 to help address the operating budget shortfalls associated with the ridership declines, should that not be the case in 2022, decisions will need to be made with respect to balancing the operating budget in light of the anticipated slow return to historic ridership levels.
Recommended by:
Katie Burns, Director of Planning
Shawn Wilson, Director of Operations
Mike Gregor, Director of Finance
Concurred in by:
Kelly S. Paleczny, General Manager