Staff Report #4
April 4, 2023
To All Members of the Accessible Public Transit Service Advisory Committee
Re: 2022 Conventional Transit Service Performance Report
Recommendation
The report be NOTED and FILED.
Background
In the 2019-2022 Business Plan, London Transit’s vision is: “The valued and trusted mobility choice for Londoners”. The vision is supported by the mission statement, “Moving Londoners – progressively, reliably and affordably”. The vision and mission statements give direction to five congruent and competing strategic outcomes, namely:
- An integrated, affordable and valued mobility choice
- An engaged, diverse and respectful workplace
- Demonstrated fiscal accountability
- Being open, transparent and understood
- Effective utilization of infrastructure
While 2022 saw relief from most pandemic-related restrictions, it was not immune from pandemic-related impacts; the two most significant of which were supply chain and labour market. While transit riders began to return to pre-pandemic travel patterns and service expectations at an increasing rate, the ability of the organization to respond with increased service levels to better match the increased demand was significantly hampered.
In order to increase service levels to first return to pre-pandemic levels and then begin implementation of the 2021 and 2022 service improvements, the depleted Operator complement needed to be addressed. As such, a focused effort on Operator recruitment and onboarding began in mid-2021, and will continue through the remainder of 2023. Between April 2021 and the end of 2022, 122 Operators were hired, trained and placed in service. At the end of the 2022, approximately 27% of the Operator complement had less than two years’ experience as a London Transit Operator, and no experience in pre-pandemic conditions of significant crowding.
While recruitment and on-boarding for the Operator position ran relatively smoothly throughout 2022, the vacancies in the Fleet and Facilities department proved more difficult to fill. This coupled with short term absences throughout the year, resulted in difficulties completing the work assigned to each shift in order to ensure bus availability for service each day. Adding to this difficulty was the delay in receipt of the 2022 replacement bus order, which resulted in the need to maintain 17 buses longer than anticipated. In a number of cases, the decision was made to park the bus scheduled for retirement rather than perform costly repairs however this approach negatively impacted the total fleet availability.
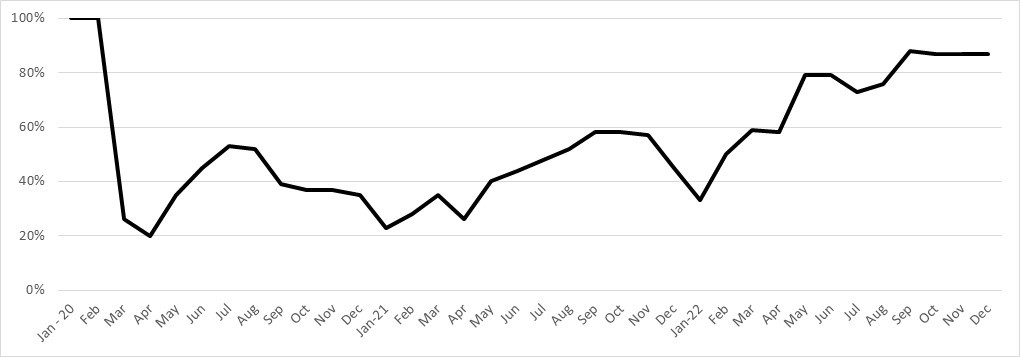
The aforementioned impacts resulted in service levels not being increased to pre-pandemic levels in 2022, notwithstanding the significant increases in ridership. The differential between the service levels operating and those required to meet the demand negatively impacted a number of the measures utilized to assess the conventional transit service performance in 2022. The following chart provides an overview of the ridership levels experienced throughout the pandemic period. As depicted in the chart, 2022 ridership levels were, for the most part, the highest since the onset of the pandemic.
Ridership As A Percent of Pre-Pandemic (2019) Levels
Notwithstanding the impacts of the pandemic, the remainder of the report will provide the traditional year over year and actual to budget comparisons in the interest of transparency. Additional commentary will be provided with the indicators discussing the impacts of the pandemic.
Conventional transit service performance is measured in terms of fiscal accountability (efficiency), service (effectiveness and quality), and communication (accuracy and quality of information provided). Each of these areas is discussed in greater detail in the remainder of the report.
Conventional Transit Service – Efficiency
The following table provides a summary of ridership and revenue service hours actual to budget performance for 2022 (unaudited).
2022 Ridership and Service Hours – Actual versus Budget (unaudited)
| Description | Actual | Budget | Percent Better (Worse) |
| Revenue service hours (millions) | 0.618 | 0.666 | (3.3)% |
| Ridership (millions) | 13.366 | 16.217 | (27.3)% |
| Rides per capita | 31.1 | 37.4 | (17.6)% |
| Rides per revenue service hour | 21.6 | 24.4 | (40.9)% |
| Service hours per capita | 1.4 | 1.5 | (7.2)% |
As indicated earlier in this report, while ridership levels were the highest in 2022 since the onset of the pandemic, they did not reach what was budgeted. This was in part due to the pandemic wave that hit in early 2022, which saw significant ridership declines for two months. The revenue service hours provided were also less than budgeted, noting the plan to return to pre-pandemic service levels in 2022 did not occur due to the aforementioned resource issues.
The rides per service hour statistic demonstrates the impact of leaving higher levels of service in place than ridership would have traditionally warranted, noting buses were approximately 41% less-full system-wide than what was budgeted. Given this metric is based on a system-wide average, it is acknowledged that some bus routes continued to experience full loads, while others were not as crowded.
The following table provides comparisons in the various ridership and service hour measures over the past four years.
Ridership and Service Hour Comparisons – 2019 through 2022
| Description | 2019 | 2020 | 2021 | 2022 |
| Revenue service hours (millions) | 0.656 | 0.596 | 0.611 | 0.618 |
| Ridership (millions) | 24.600 | 12.681 | 8.266 | 13.366 |
| Rides per capita | 60.1 | 30.6 | 20.0 | 31.1 |
| Rides per revenue service hour | 37.8 | 21.3 | 13.5 | 21.6 |
| Service hours per capita | 1.6 | 1.4 | 1.5 | 1.4 |
The four year comparison is traditionally utilized to monitor the growth in service over the period. As set out in the table, the pandemic resulted in significant impacts on each of these measures for 2020 through 2022; however the 2019 number can be viewed as a pre-pandemic benchmark. As previously discussed, both service hours and ridership reached the highest levels since the onset of the pandemic in 2022.
Customer Satisfaction
In an effort to gather first-hand feedback from transit riders, the Voice of the Customer survey process was implemented in 2016. This process involves face to face interviews with riders on-board conventional service buses, providing the opportunity to reach customers who may not be inclined to contact customer service with a complaint or compliment. It is a known fact that a customer is more likely to contact an organization when they have had a poor experience versus a good one, and the traditional reliance on customer contacts only to assess overall customer satisfaction was deemed to be insufficient. The Voice of the Customer allows customers to rate each area of service on their perception of how it meets their needs. Unfortunately, the Voice of the Customer survey process was placed on hold during the pandemic (with the last one being completed in the winter of 2018), so there is no current data to provide in this report. The Voice of the Customer survey is scheduled to resume in 2023 and results will be included in this report going forward.
In addition to the Voice of Customer feedback, customer satisfaction levels are also gauged through tracking both the number and nature of customer contacts received via email, social media, and telephone. In 2022, society in general was looking to return to conditions consistent with pre-pandemic times while at the same time businesses struggled to ramp up to meet the heightened demand given labour market and supply chain issues. The resulting imbalance between customer expectations and the service provider’s ability to deliver has led to a decrease in overall satisfaction levels, and increased customer frustrations. The nature of interactions with unhappy customers in 2022 transitioned from traditional expressions of dissatisfaction to exchanges including profanity, name calling, and in some cases, verbal assault. While all London Transit employees dealing with the public are trained in de-escalation, these exchanges are difficult to be party to. Egregious behavior of this nature can result in a customer being banned from service. One of the primary focuses of public communications in 2023 will be the need for respectful interactions when utilizing LTC services.
Service Performance
In addition to the Voice of the Customer surveys, customer satisfaction levels with service performance are measured through customer contacts received. When considering these numbers, it is important to recognize that not all contacts are investigated and as such, have not been confirmed as an accurate characterization of the event. Contacts that are serious in nature or those in which the customer requests a response are each investigated.
As set out in the following chart, service performance complaints expressed in terms of 100,000 riders increased at the onset of the pandemic in 2020, and have continued on that trajectory through 2022. Complaints per 100,000 riders is utilized in order to normalize the years where significant ridership fluctuation has occurred. As important as the overall number of complaints received, is the nature of the complaints, all of which are analyzed to assess the impacts of the previous years’ service plan changes as well as to plan for future service changes. The table below sets out a breakdown of the number of service complaints over the four-year period by category, as well as a percentage change in each category over the period.
Total Service Performance Complaints by Category 2019-2022
| Complaints – Service | 2019 | 2020 | 2021 | 2022 | % Change |
| Detour/off route | 71 | 57 | 72 | 71 | –% |
| Early schedule | 81 | 62 | 69 | 82 | 1% |
| Late schedule | 462 | 160 | 178 | 263 | (43)% |
| Missed passenger – drove by | 370 | 320 | 278 | 311 | (16)% |
| Missed passenger – not at stop | 341 | 241 | 182 | 239 | (30)% |
| Overcrowding | 55 | 88 | 15 | 45 | (18)% |
| Transfer connection | 36 | 21 | 25 | 36 | –% |
| Total | 1,416 | 949 | 819 | 1,047 | (26)% |
| Per 100,000 riders | 5.76 | 7.48 | 9.91 | 7.83 | 36 % |
While the levels of service and ridership over the pandemic period varied significantly, the top categories of complaints with respect to service received have remained consistent. Late scheduled complaints relate to service not arriving at a stop at the scheduled time. The nature and extent of construction projects spanning much of 2022 impacted a significant number of routes, and given resource limitations, tripper buses were not able to be assigned to routes experiencing schedule adherence difficulties. Missed passenger complaints are broken down between “drove by”, which infers the bus drove by a passenger waiting at a stop, and “not at stop” which indicates the passenger was not at the designated stop (e.g. running for the bus). In the case of the passengers that were waiting at the stop and not picked up, the majority of these cases are the result of a bus being too full to pick up additional passengers. This occurred frequently on a number of routes in the fall of 2022 as the service levels in place on many routes were not meeting the growing ridership demand. As indicated earlier, the nature and extent of construction projects in 2022 resulted in numerous routes being on detour with regular stops closed and temporary stops in place. Early in the summer, it was discovered that many of the closed stop/temporary stop signs were missing from poles (primarily in the core), which left customers waiting at the wrong locations. Given these issues, an audit process was established and conducted by Inspectors on a regular basis to ensure proper and accurate signage was posted along all detoured routes.
Another factor that can impact service performance is service interruptions stemming from vehicle breakdowns. The table below sets out the mean kilometers between service interruptions, further broken down between those requiring the bus to be changed off and returned to the garage and those that could be fixed on-route by the mobile mechanic. While both categories represent an inconvenience to customers and an interruption to service, those that can be addressed by the mobile mechanic on-route cause less of a disruption.
Mean KMs Between Service Interruptions – 2019-2022
| Description | 2019 | 2020 | 2021 | 2022 |
| Service pull-ins | 2,305 | 1,760 | 1,711 | 1,900 |
| Mean kms between pull ins | 5,810 | 6,774 | 7,473 | 6,909 |
| Year over year change | 7% | 8% | 6% | -8% |
| In-service repairs (mobile mechanic) | 3,158 | 2,887 | 2,983 | 2,991 |
| Mean kms between in-service repairs | 4,241 | 4,347 | 4,286 | 4,389 |
| Year over year change | 2% | -2% | 1% | 2% |
Service pull-ins, measured in terms of mean revenue kilometers between incidents has been better than pre-pandemic levels. This category is the most disruptive of the two, as it requires customers to vacate the bus and transfer to a replacement bus. As such, efforts are made to identify the issues resulting in these instances, and ensure the mobile mechanics are equipped, where possible, to rectify these issues on road. Approximately 20% of these events in 2022 were the result of engine issues. Administration is continuing to work with the engine manufacturer to rectify these issues, noting at time of report writing there are five buses down with engine issues.
In-service repairs (road service calls) and service pull-ins have a negative impact on the quality of customer service (e.g. schedule adherence). These events are inherent in public transit operations given such factors as weather and road conditions, the constant start/stop nature of the operation and the increased complexity and sensitivity associated with bus systems and related ancillary equipment (e.g. Automatic Vehicle Location (AVL), electronic fare boxes, smart card equipment, etc.).
Operator Performance
Consistent with service related contacts, customer contacts (complaints and compliments) regarding Operator performance are also tracked and trended. Performance results for 2019 through 2022 with respect to Operator complaints are set out in the following table. When comparing the number of complaints from previous years, either in total or by category, it is important to remember that ridership and service levels also fluctuated significantly. The total complaints per 100,000 kilometers provides a normalized indication of the trends in complaints year over year.
Total Operator Complaints by Category 2019-2022
| Complaints – Operator Performance | 2019 | 2020 | 2021 | 2022 | % Change |
| Speeding | 40 | 42 | 43 | 71 | 78 % |
| Unsafe manner | 426 | 232 | 253 | 320 | (25)% |
| Deadheaded | 23 | 9 | 1 | 6 | (74)% |
| Idling | 13 | 26 | 21 | 26 | 100% |
| Drive through red light | 45 | 21 | 23 | 30 | (33)% |
| Not stopping at stop sign | 16 | 17 | 8 | 6 | (63)% |
| Yield to Bus | 61 | 29 | 20 | 25 | (59)% |
| Quality of Ride | 54 | 34 | 19 | 33 | (39)% |
| Splashed Pedestrian | 10 | 5 | 6 | 2 | (80)% |
| Total Driving Related | 688 | 415 | 394 | 519 | (25)% |
| Attitude/Treatment | 651 | 588 | 361 | 428 | (34)% |
| Presentation | 47 | 62 | 56 | 65 | 38 % |
| Smoking | 8 | 13 | 4 | 4 | (50)% |
| Cell Phone | 26 | 17 | 14 | 17 | (35)% |
| Missed stop requested | 71 | 47 | 37 | 57 | (20)% |
| Total Service received | 803 | 727 | 472 | 571 | (29)% |
| Total | 1,491 | 1,142 | 866 | 1,090 | (27)% |
| Per 100,000 kilometres | 11.08 | 9.01 | 6.77 | 8.30 | (25)% |
As indicated in the table, total complaints for each of the three years post the onset of the pandemic are down significantly. Extrapolating that number into per 100,000 kilometres travelled provides a normalized comparison given the levels of service on the road varied significantly over the period. Consistent with the total complaints, the complaints per 100,000 kilometres is also approximately 25% less than pre-pandemic levels.
As compared to 2019, driving related Operator complaints in 2022 declined by 27%, with decline in virtually every category tracked. The makeup of complaints per category also remained relatively consistent over the period, notwithstanding the differing operating conditions in each of the years. The most significant change over the four year period occurred in the speeding category, with the number of complaints growing from 40 to 71. Further analysis of these complaints identified that the majority involved areas where speed limits had recently been reduced to 40 kmh. Communication was provided to Operators detailing the routes affected by these speed limit reductions, and reminders have been shared where appropriate. Complaints of this nature will be closely monitored going forward. While the number of complaints is not significant, the doubling in the total complaints in the “idling” category is attributed to the increased need for buses to sit at stops longer than normal in order to remain on schedule (not early). The reduced vehicular traffic combined with reduced ridership resulted in the need for Operators to sit and wait at time points in order to ensure their bus did not get ahead of schedule.
Total complaints with respect to ‘service received from the Operator’ has also remained lower than pre-pandemic levels for each of the years. The largest number of complaints in this category (representing approximately 75% of the total in 2022) relate to driver attitude and passenger treatment. While not all complaints are investigated, they are tracked for Operators who are trending and/or have numerous complaints, and in those cases follow up with the Operator takes place.
In the case of complaints alleging a significant Operator performance issue, an investigation is completed, which can include any or all of the following; interview with the Operator and complainant, assessment of AVLC data, review of the bus’ audio/visual system (noting there is a strict protocol for accessing the system recordings). It should be noted that contacts received from customers are based on the customer’s perception of the incident, and are not always consistent with what actually occurred. In all situations, when requested, a response regarding the assessment is provided to the customer who filed the contact.
Operator performance compliments are also tracked and trended. The chart below sets out the trend in Operator compliments over the period of 2019 through 2022. The significant variance in total complaints versus total compliments reinforces the earlier commentary that customers are far more likely to call and complain when they receive poor service versus offer a compliment for good service.
Total Operator Compliments by Category 2019-2022
| Operator Performance | 2019 | 2020 | 2021 | 2022 | % Change |
| Attitude/Treatment | 213 | 240 | 114 | 132 | (38)% |
| Presentation | 1 | 2 | 1 | 2 | 100 % |
| Total | 214 | 242 | 115 | 134 | (37)% |
| Per 100,000 riders | 0.87 | 1.91 | 1.39 | 1.00 | 15 % |
These expressions of gratitude were shared directly with employees where possible, as well as through postings on internal screens and quoted in the employee newsletter. These messages were well-received and appreciated by all LTC employees who continued to do their part in ensuring the service continued to operate.
Service Safety
The tables below set out the total number of motor vehicle accident reports for each year for the period of 2019 through 2022. The numbers in this table represent all motor vehicle accidents that were reported in the given year, it is important to note that not all accidents result in a collision/injuries, nor do they all result in damage to a vehicle or an interruption in service.
Summary of Motor Vehicle Accidents – On Road 2019-2022
| Description | 2019 | 2020 | 2021 | 2022 |
| Number of reports | 369 | 293 | 315 | 416 |
| · Preventable | 152 | 143 | 149 | 168 |
| · Non-Preventable | 217 | 150 | 166 | 248 |
| Total per million km | 27.5 | 23.3 | 24.6 | 31.7 |
| Per 100,000 service hours | 56.3 | 49.2 | 51.6 | 67.3 |
| Mean km between reports | 34,882 | 42,835 | 40,589 | 31,553 |
| Year over year percent change | 2% | 18% | (5)% | (22)% |
The table above provides a breakdown between preventable and non-preventable motor vehicle accidents in each of the four years. Accidents deemed as preventable are those where the Operator could or should have taken measures to avoid the accident. The causes of preventable accidents are closely monitored for trends, and in the event any are identified, the Operator training programs are reviewed in order to assess whether changes or additions need to be made. In the cases where a specific Operator is trending, additional training and/or a ride around with a training supervisor is arranged in order to mitigate further accidents going forward. In 2022, 70% of the preventable accidents were classified as “clearance” issues where objects or other vehicles were struck by the bus. As this trend emerged in 2022, the new operator training program was amended to include additional time driving in a training course focusing on clearance issues.
Additional analysis of the preventable accidents identified that the majority are occurring with Operators having less than two years driving experience. The increase in preventable accidents is believed to be directly related to the current Operator complement makeup, of which approximately 27% have less than two years’ experience given the rapid rate of hiring over the past 18 months. The increased rates of preventable accidents within this group could also be related to the elimination of the 2,000 hours of driving experience with requisite license from the Operator posting in 2019. This change was made given difficulties with filling Operator positions, and the New Operator training program was altered to include additional driving time.
The category of non-preventable accidents provides insight into the performance of other drivers on the road in London. This number is up considerably over both pre-pandemic levels and those experienced in the first two years of the pandemic. Approximately 47% of the non-preventable accidents in 2022 were the result of an LTC bus being hit while at a bus stop or sideswiped by another vehicle.
MVAs are closely monitored and trended throughout the year, and communication programs are undertaken to provide Operators with quick tips for mitigating the most common causes. Additionally, Operators who have experienced multiple incidents are provided with refresher training targeting areas of concern.
Passenger falls are an example of motor vehicle accidents that don’t necessarily involve a collision. These accidents are closely monitored and trended as they are the most likely to result in an injury to the passenger. The following table provides a summary of the passenger fall incidents recorded in each of the past four years, broken down between those that occurred while the bus was in motion, and those that occurred when the bus was stationary (e.g. during boarding or alighting).
Summary of Passenger Falls – 2019-2022
| Description | 2019 | 2020 | 2021 | 2022 |
| In motion | 26 | 14 | 27 | 43 |
| Stationary | 17 | 9 | 13 | 28 |
| Total | 43 | 23 | 40 | 71 |
| Per million km | 3.2 | 1.8 | 3.1 | 5.4 |
| Year over year percent change | 3% | (43)% | 71% | 73% |
The majority (88%) of passenger falls in 2022 were deemed non-preventable meaning there was nothing the Operator could have done to prevent it. In most cases, these types of falls are the result of a passenger not holding on to the hand-hold or stanchion while standing on the bus. Should the Operator need to quickly apply the brakes, or undertake a maneuver to avoid another vehicle, a passenger that is not holding on is likely to fall. When this trend was identified in 2022, a communications campaign was undertaken reminding riders to hold on while standing.
The nature and extent of accidents/incidents are reflective of a number of factors including:
- changing and severity of weather conditions;
- increased road congestion and issues of road conditions; and
- heightened service and customer service expectations.
All passenger fall reports are reviewed, including, as warranted, accessing audio/visual system recordings to investigate the event, all of which is shared with the Commission’s adjuster and legal counsel. The management of accidents/incidents is critical to providing passengers with a safe trip as well as mitigating risk and liability. In terms of cost and risk, the vast majority of the reported accidents/incidents are minor in nature reflecting in part the broad definition of what constitutes an accident/incident.
Administration is currently undertaking an assessment of additional measures that could be put in place to assist newer Operators, including but not limited to the provision of enhanced feedback and coaching subsequent to a preventable accident or passenger fall.
Access to LTC Information
Customers and the public at large have a number of options to interact with London Transit. Those looking for dialogue, or some form of response, can use the customer service phone line or email. Given emails can be directed at any member of LTC administration, the total emails received and responded to are not tracked. Calls into the customer service department are tracked and trended against previous years’ experience. The table below sets out the total incoming calls to the customer service line in each of the years 2019 through 2022.
Summary of Customer Access – LTC Customer Service Line
| Description | 2019 | 2020 | 2021 | 2022 | % Change |
| Information line – answered calls(1) | 87,972 | 70,520 | 60,152 | 79,009 | (9.1)% |
| Interactive voice response(2) | 183,589 | 123,059 | 109,566 | 114,341 | (38.0)% |
| Calls per million rides | 0.011 | 0.015 | 0.020 | 0.015 | 31.3 % |
- Information Line statistics are for the hours of 6a.m. – 10p.m. Monday through Friday and 8:30a.m. – 4:30p.m. on weekends and statutory holidays. Service information provided by staff is based upon real-time information. Staff also assists with trip planning and answers other common questions.
- Interactive Voice Response (IVR) – IVR is a phone system that utilizes voice recognition technology to assist customers with providing real-time information by stop for conventional transit.
As indicated in the table, the total number of calls to both the information line and the interactive voice response did decline through the pandemic period; however, the 2022 data indicates an increase toward pre-pandemic levels.
Other ways in which customers and the public at large can stay connected with London Transit is through the website where information about the service in general as well as information regarding Detours & Stop Closures can be found. For the most accurate information with respect to the next bus arrival, riders are directed to stay informed through the Infoweb real-time site; detour and stop closure alerts can also be found on this site. Additionally, onboard posters for major campaigns and a corporate Facebook page is also maintained that provides general news and updates relating to our services.
In addition to the more-static information discussed above, an interactive corporate Twitter account is utilized to provide updates with respect to service as well as to draw attention to specific information contained on the corporate website.
The table below sets out a summary of the visits to the LTC website, Infoweb real-time, corporate Facebook page and the total Twitter impressions from the corporate Twitter account for the years 2019 through 2022.
Summary of Customer Access – LTC Website
| Description | 2019 | 2020 | 2021 | 2022 | % Change |
| Website – main site visits(1) (millions) | 1.647 | 1.024 | 0.870 | 1.072 | (34.9)% |
| Website – Infoweb real-time(1) (millions) | 0.518 | 0.324 | 0.318 | 0.463 | (10.6)% |
| Facebook visits | 0.072 | 0.151 | 0.060 | 0.062 | (13.9)% |
| Twitter Impressions(2) | 1.466 | 0.980 | 0.422 | 0.421 | (71.3)% |
| Site visits per million rides | 0.151 | 0.195 | 0.202 | 0.148 | (2.0)% |
- The numbers included in these items are based on Google Analytics sessions. A session is defined as the amount of time a user is actively engaged with the site, and all usage within that engagement is measured as one session.
- Twitter impressions represent a total of all the times Tweets originating from the corporate Twitter account have been seen.
Consistent with the calls to the information line, website visits, although down in number, have returned to pre-pandemic levels in terms of visits per million rides, these indicate the continued reliance on this source of information for riders throughout the pandemic as procedures and service levels changed.
The following table provides an overview of the makeup of the various methods that customers and the public can utilize to find information with respect to public transit services. It should be noted that some information is limited to only one source (e.g. Commission agendas limited to corporate website), and as such, the addition of alternative methods of interaction may not directly impact others. The table below sets out the percent make-up of the various methods of interaction between LTC and the public at large.
Percent Make Up of Interaction Methods
| Percent Make Up | 2019 | 2020 | 2021 | 2022 |
| Information line – answered calls | 2.2% | 2.7% | 3.3% | 3.6% |
| Interactive voice response | 4.6% | 4.6% | 5.9% | 5.2% |
| Website – main site visits | 41.4% | 38.3% | 47.3% | 48.5% |
| Website – Infoweb real-time | 13.0% | 12.1% | 17.3% | 20.9% |
| Facebook page visits | 1.8% | 5.6% | 3.3% | 2.8% |
| Twitter Impressions | 36.9% | 36.7% | 22.9% | 19.0% |
| Total | 100.0% | 100.0% | 100.0% | 100.0% |
The use of the Customer Service line, the website and Twitter continue to represent the majority of customer interactions with London Transit in 2022.
In addition to the above access points, the LTC currently provides approximately 50,000 ride guides and Route Schedules remain available on the LTC website in a printable format for those wishing a hard copy.
Going Forward
Feedback received in 2022 through the various methods discussed in this report will be utilized as input into the future Conventional Transit Service Plans and the 2023-2026 Business Plan.
Recommended by:
David Butler, Manager of Operations Administration
Caroline Roy, Manager of Corporate Communications
Craig Morneau, Director of Fleet & Facilities
Shawn Wilson, Director of Operations
Concurred in by:
Kelly S. Paleczny, General Manager