Staff Report #5
February 28, 2024
To All Commissioners
Re: 2023 Conventional Transit Service Performance Report
Recommendation
The report be NOTED and FILED.
Background
In the 2019-2023 Business Plan, London Transit’s vision is: “The valued and trusted mobility choice for Londoners”. The vision is supported by the mission statement, “Moving Londoners – progressively, reliably and affordably”. The vision and mission statements give direction to five congruent and competing strategic outcomes, namely:
- An integrated, affordable and valued mobility choice
- An engaged, diverse and respectful workplace
- Demonstrated fiscal accountability
- Being open, transparent and understood
- Effective utilization of infrastructure
2023 brought with it a societal shift that went from ongoing but waning concern about the pandemic in 2022 to the expectation that the pandemic was over and things should return to “normal” immediately in 2023. While the elimination of pandemic-related restrictions and reduction in supply chain and labour market issues greatly assisted service providers in ramping up service levels, progress toward this return was slower than customer expectations.
The plan for conventional service in 2023 was to focus on implementing the remaining outstanding service hour improvements that had been planned for 2021 and 2022 as resources permitted, with the ultimate goal of having all outstanding service improvements implemented by the end of the year. While significant progress was made, with improvements implemented in April, June and September, an approximate 6,000 hours in improvements had to be scheduled for implementation in February and April 2024 due to labour-force shortfalls negatively affecting bus availability.
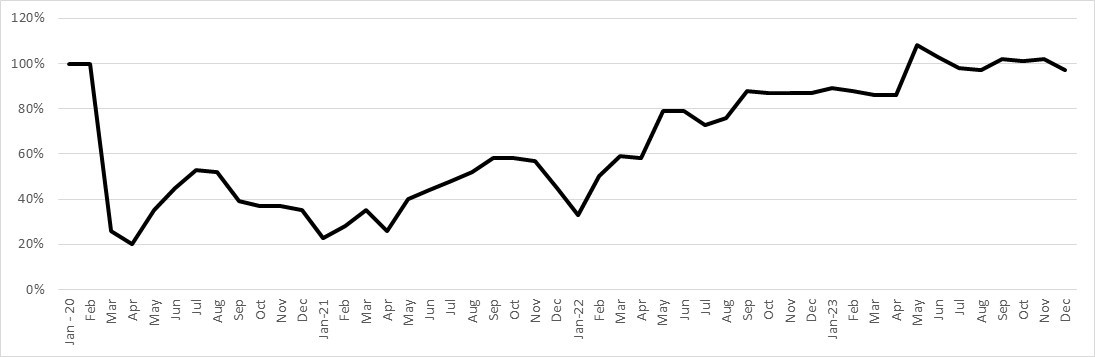
The following chart provides an overview of the ridership levels experienced throughout the pandemic period. As depicted in the chart, 2023 ridership levels returned to and surpassed pre-pandemic levels.
2020 – 2023 Boardings as a Percent of Pre-Pandemic (2019) Levels
Bus availability challenges throughout 2023 also resulted in the inability to add extra buses to routes experiencing schedule adherence issues resulting from the significant number of construction projects in 2023 which resulted in every route being on detour at some time during 2023. These challenges were the result of a combination of being below complement in the mechanic group coupled with delays in the receipt of the 2022 replacement bus order, requiring older buses to be maintained for service longer than anticipated.
The slower than planned implementation of service improvements, coupled with the inability to respond to construction-related schedule adherence issues resulted in a less than desirable conventional transit services for riders across the city. Service issues coupled with the general decline in societal civil discourse has resulted in increased instances of inappropriate and disrespectful discussions between customers and front-facing London Transit employees, a number of which have escalated to the point of violence in the workplace.
Conventional transit service performance is measured in terms of fiscal accountability (efficiency), service (effectiveness and quality), and communication (accuracy and quality of information provided). Each of these areas is discussed in greater detail in the remainder of the report.
Conventional Transit Service – Efficiency
The following table provides a summary of ridership and revenue service hours actual to budget performance for 2023 (unaudited).
2023 Ridership and Service Hours – Actual versus Budget (unaudited)
| Description | Actual | Budget | Percent Better (Worse) |
| Revenue service hours (millions) | 0.682 | 0.686 | (0.6)% |
| Ridership (millions) | 18.413 | 17.507 | 5.2 % |
| Rides per capita | 41.8 | 39.8 | 5.2 % |
| Rides per revenue service hour | 27.0 | 25.5 | 5.8 % |
| Service hours per capita | 1.6 | 1.6 | — |
Ridership levels in 2023 exceeded budget expectations by approximately 0.9 million rides. As the table below indicates, ridership outperformed budget estimates in all categories with the exception of cash. The variance in the ticket category can be attributed in part to modified work schedules and riders not utilizing transit often enough to get the value out of the monthly pass. The tuition pass category variance is directly tied to enrollments at the participating institutions being higher than anticipated at the time the budget was finalized.
2023 Ridership by Fare Category – Actual vs Budget (unaudited)
| Ridership (millions) | |||
| Fare Category | Actual | Budget | Variance |
| Cash | 1.059 | 1.104 | (4.1)% |
| Ticket/Stored Value | 4.595 | 4.384 | 4.9 % |
| Monthly Pass | 2.622 | 2.610 | 0.4 % |
| Tuition Pass | 10.138 | 9.409 | 7.7 % |
| Total | 18.413 | 17.507 | 5.2 % |
The following table provides comparisons in the various ridership and service hour measures over the past four years.
Ridership and Service Hour Comparisons – 2019 through 2023
| Description | 2019 | 2020 | 2021 | 2022 | 2023 |
| Revenue service hours (millions) | 0.656 | 0.596 | 0.611 | 0.618 | 0.682 |
| Ridership (millions) | 24.600 | 12.681 | 8.266 | 13.366 | 18.413 |
| Rides per capita | 60.1 | 30.6 | 20.0 | 31.1 | 41.8 |
| Rides per revenue service hour | 37.8 | 21.3 | 13.5 | 21.6 | 27.0 |
| Service hours per capita | 1.6 | 1.4 | 1.5 | 1.4 | 1.6 |
As set out in the table, the pandemic resulted in significant impacts on each of these measures. As has been previously reported, and reflected in the graph earlier in this report, during the period of the pandemic when rear-door boarding was in place and fares were not collected, ridership numbers were calculated based on the data collected by the automatic passenger counters on buses, and reported as boardings.
When reporting ridership numbers to the Canadian Urban Transit Association (CUTA) for use in the annual transit fact book, a specific set of criteria are utilized in order to ensure all systems are reporting comparable data. Ridership numbers can be calculated in a number of ways, depending on the manner in which the transit authority collects fares. In London’s case, until 2020 all fares with the exception of the tuition pass were determined by data directly from the fare box (cash and ticket fares) and the smart card system (monthly passes, stored value and children 12 and under). Tuition pass ridership had been calculated based on ride factors determined through rider surveys given not all students participating in the tuition pass program were utilizing student cards that interacted with the smart card system (number of students multiplied by ride factors by day of week). The factors utilized for the calculation of tuition ridership were consistent across all three participating parties (Western undergrads, Western grad students and Fanshawe students). Beginning in 2022, all students participating in the tuition pass program had been transitioned to student cards capable of interface with the smart card system, and as a result, ridership for this program could also be determined based on data from the smart card system. Detailed analysis of this data determined that the factors that had been traditionally applied to calculate ridership were too high for Western University students, and too low for Fanshawe students. With approximately double the Western students participating in the program as Fanshawe, this led to a higher than actual estimation of ridership. This realization explains why the daily boardings are being reported as higher than pre-pandemic levels and the total ridership is being reported as lower. This situation is not dissimilar to that experienced by other transit systems when they transitioned away from “ride factor” ridership calculation to actual data from smart card systems.
Customer Satisfaction
In an effort to gather first-hand feedback from transit riders, the Voice of the Customer survey process was implemented in 2016. This process involves face to face interviews with riders on-board conventional service buses, providing the opportunity to reach customers who may not be inclined to contact customer service with a complaint or compliment. It is a known fact that a customer is more likely to contact an organization when they have had a poor experience versus a good one, and the traditional reliance on customer contacts only to assess overall customer satisfaction was deemed to be insufficient. The Voice of the Customer allows customers to rate each area of service on their perception of how it meets their needs. After a three year hiatus due to the pandemic, the Voice of Customer survey was reinstated in 2023. Through the remainder of this report, comparisons and contrasts will be drawn between the Voice of the Customer results from 2023 and the previous survey (2018) results where applicable. In addition, areas of focus going forward have been denoted in the tables, with the red indicating high priority, orange indicating medium priority, and green indicating no attention required.
A key aspect of the Voice of the Customer program is the manner in which it allows the customer to identify the most important factors from their perspective that would result in their satisfaction with the service. Respondents were asked to select the service characteristics which are most important to them. Respondents were also asked to indicate their level of satisfaction with each of the identified priorities. The following table provides the top priorities as the percentage of respondents that identified each of the characteristics as well as the level of satisfaction for each.
2023 Voice of the Customer Service Priorities
| Service Characteristic | Importance Ranking | Satisfaction Level | Areas of Focus |
| On-time Performance | 34% | 40% | Red |
| Frequency of Service | 11% | 58% | Red |
| Real time Timeliness Info | 10% | 58% | Red |
| Coverage | 9% | 86% | Green |
| Service Delay Information | 5% | 53% | Red |
| Convenient Routes | 5% | 75% | Orange |
In addition to the priorities listed in the table, a number of others received less than 5% of responses including hours of operation, travel time, bus cleanliness, fare price, sufficient space, safety on bus, helpful drivers, safely operated bus, days of operation, safety waiting for bus, bus stop cleanliness, courteous customer service representatives and knowledgeable drivers.
In addition to the Voice of Customer feedback, customer satisfaction levels are also gauged through tracking both the number and nature of customer contacts received via email, social media, and telephone. As indicated earlier in this report, in 2023, society in general had limited tolerance for any service that was not, in their opinion, back to pre-pandemic levels. London Transit, like many other transit systems, continued to struggle with resource issues (labour force and equipment) which slowed progress toward this return. Additionally, 2023 saw construction projects in the city balloon, resulting in detours and/or service impacts on every conventional transit route. The resulting imbalance between customer expectations and actual service levels led to a decrease in overall satisfaction levels, and increased customer frustrations. As set out Staff Report #3, dated February 28, 2024, a primary focuses of on-board communications in 2024 will be the need for respectful interactions when utilizing LTC services.
In each of the remaining sections of the report, comparisons and contrasts between the Voice of the Customer survey results and customer contacts received throughout 2023.
Service Performance
In addition to the Voice of the Customer surveys, customer satisfaction levels with service performance are measured through customer contacts received. When considering these numbers, it is important to recognize that not all contacts are investigated and as such, have not been confirmed as an accurate characterization of the event. Contacts that are serious in nature or those in which the customer requests a response are each investigated.
As set out in the following chart, service performance complaints expressed in terms of 100,000 riders increased at the onset of the pandemic in 2020 and again in 2021, but then began to decline in 2022 and again in 2023. Complaints per 100,000 riders is utilized in order to normalize the years where significant ridership fluctuation has occurred. As important as the overall number of complaints received, is the nature of the complaints, all of which are analyzed to assess the impacts of the previous years’ service plan changes as well as to plan for future service changes. The table below sets out a breakdown of the number of service complaints over the period by category, as well as a percentage change in each category over the period.
Total Service Performance Complaints by Category 2019-2023
| Complaints – Service | 2019 | 2020 | 2021 | 2022 | 2023 | % Change | Area of Focus |
| Detour/off route | 71 | 57 | 72 | 71 | 87 | 23 % | Orange |
| Early schedule | 81 | 62 | 69 | 82 | 56 | (31)% | Green |
| Late schedule | 462 | 160 | 178 | 263 | 329 | (29)% | Red |
| Missed passenger – drove by | 370 | 320 | 278 | 311 | 346 | (6)% | Red |
| Missed passenger – not at stop | 341 | 241 | 182 | 239 | 246 | (28)% | Red |
| Crowding | 55 | 88 | 15 | 45 | 66 | 20 % | Orange |
| Transfer connection | 36 | 21 | 25 | 36 | 6 | (83)% | Green |
| Total | 1,416 | 949 | 819 | 1,047 | 1,136 | (20)% | Green |
| Per 100,000 riders | 5.76 | 7.48 | 9.91 | 7.83 | 6.17 | 7 % |
While the levels of service and ridership over the pandemic period varied significantly, the top categories of complaints with respect to service received have remained consistent. Late scheduled complaints relate to service not arriving at a stop at the scheduled time. As indicated earlier in this report, the nature and extent of construction projects spanning much of 2023 impacted a significant number of routes, and given resource limitations, tripper buses were not able to be assigned to routes experiencing schedule adherence difficulties. Missed passenger complaints are broken down between “drove by”, which infers the bus drove by a passenger waiting at a stop, and “not at stop” which indicates the passenger was not at the designated stop (e.g. running for the bus). In the case of the passengers that were waiting at the stop and not picked up, the majority of these cases are the result of a bus being too full to pick up additional passengers. Throughout 2023, and more predominantly through the last quarter, “full bus” occurrences were recorded on a daily basis on numerous routes.
The nature of the detours in the core and the resulting stop closures continued to lead to confusion for riders with respect to where to catch their bus. In 2022, a number of changes were implemented to the temporary stop program in an effort to ensure up-to-date and accurate information is available at all stops affected by detours. When looking at the total number of complaints relating to passenger not at stop, it increased slightly over 2022; however, if this number is calculated based on complaints per rider, this category saw a 25% decline in 2023 versus 2022.
Another factor that can impact service performance is service interruptions stemming from vehicle breakdowns. The table below sets out the mean kilometers between service interruptions, further broken down between those requiring the bus to be changed off and returned to the garage and those that could be fixed on-route by the mobile mechanic. While both categories represent an inconvenience to customers and an interruption to service, those that can be addressed by the mobile mechanic on-route cause less of a disruption.
Mean KMs Between Service Interruptions – 2019-2023
| Description | 2019 | 2020 | 2021 | 2022 | 2023 | Area of Focus |
| Service pull-ins | 2,305 | 1,760 | 1,711 | 1,900 | 2,195 | |
| Mean kms between pull ins | 5,810 | 6,774 | 7,473 | 6,909 | 6,530 | Orange |
| Year over year change | 7% | 8% | 6% | -8% | -5% | |
| In-service repairs (mobile mechanic) | 3,158 | 2,887 | 2,983 | 2,991 | 3,228 | |
| Mean kms between in-service repairs | 4,241 | 4,347 | 4,286 | 4,389 | 4,440 | Orange |
| Year over year change | 2% | -2% | 1% | 2% | 1% |
Service pull-ins, measured in terms of mean revenue kilometers between incidents reached the highest levels of the pandemic period in 2023. The increased rate of breakdowns in 2023 is not unexpected given the delays in delivery of the 2023 replacement buses resulting in the need to keep older buses, scheduled for retirement, on the road longer than planned. Given the labour-force shortage in the mechanic complement, coupled with the need to maintain buses longer than planned, the Fleet and Facilities department should be commended for meeting service requirements on a daily basis and mitigating, to the extent possible, service interruptions relating to breakdowns. This category is the most disruptive of the two, as it requires customers to vacate the bus and transfer to a replacement bus. As such, efforts are made to identify the issues resulting in these instances, and ensure the mobile mechanics are equipped, where possible, to rectify these issues on road. Approximately 24% of these events in 2023 were the result of engine issues (engine lights, excessive regen, injectors).
In-service repairs (road service calls) and service pull-ins have a negative impact on the quality of customer service (e.g. schedule adherence). These events are inherent in public transit operations given such factors as weather and road conditions, the constant start/stop nature of the operation and the increased complexity and sensitivity associated with bus systems and related ancillary equipment (e.g. Automatic Vehicle Location (AVL), electronic fare boxes, smart card equipment, etc.).
A review of the Voice of the Customer survey results relating to service performance echo the trends discussed above, with a general dissatisfaction with on-time performance. Of particular note, customers who participated in the Voice of the Customer survey indicated that on-time performance is their highest priority when assessing the conventional transit service.
2018 & 2023 Voice of the Customer Results
| % Agree | |||
| Voice of the Customer Statement | 2018 | 2023 | Area of Focus |
| · There is enough seating on the bus | 64% | 64% | Orange |
| · Bus runs on time | 49% | 40% | Red |
As the table above indicates, there has been a significant decline in the perception of customers relating to the service operating on time in 2023 as compared to the pre-pandemic survey. In order to address this issue, significant focus in the next 5 Year Service Plan will need to be dedicated to existing routes, adding resources where necessary to ensure service levels better match demand.
Operator Performance
Consistent with service related contacts, customer contacts (complaints and compliments) regarding Operator performance are also tracked and trended. Performance results for 2019 through 2023 with respect to Operator complaints are set out in the following table. When comparing the number of complaints from previous years, either in total or by category, it is important to remember that ridership and service levels also fluctuated significantly. The total complaints per 100,000 kilometers provides a normalized indication of the trends in complaints year over year.
Total Operator Complaints by Category 2019-2023
| Complaints – Operator Performance | 2019 | 2020 | 2021 | 2022 | 2023 | % Change | Area of Focus |
| Speeding | 40 | 42 | 43 | 71 | 64 | 60 % | Red |
| Unsafe manner | 426 | 232 | 253 | 320 | 367 | (14)% | Red |
| Deadheaded | 23 | 9 | 1 | 6 | 16 | (30)% | Green |
| Idling | 13 | 26 | 21 | 26 | 30 | 131% | Green |
| Drive through red light | 45 | 21 | 23 | 30 | 37 | (18)% | Green |
| Not stopping at stop sign | 16 | 17 | 8 | 6 | 21 | 31 % | Green |
| Yield to Bus | 61 | 29 | 20 | 25 | 57 | (7)% | Green |
| Quality of Ride | 54 | 34 | 19 | 33 | 37 | (31)% | Green |
| Splashed Pedestrian | 10 | 5 | 6 | 2 | 5 | (50)% | Green |
| Total Driving Related | 688 | 415 | 394 | 519 | 634 | (8)% | |
| Attitude/Treatment | 651 | 588 | 361 | 428 | 508 | (22)% | Red |
| Presentation | 47 | 62 | 56 | 65 | 101 | 115 % | Orange |
| Smoking | 8 | 13 | 4 | 4 | 14 | (75)% | Green |
| Cell Phone | 26 | 17 | 14 | 17 | 33 | 27 % | Green |
| Missed stop requested | 71 | 47 | 37 | 57 | 63 | (11)% | Green |
| Total Service received | 803 | 727 | 472 | 571 | 719 | (10)% | |
| Total | 1,491 | 1,142 | 866 | 1,090 | 1,353 | (9)% | |
| Per 100,000 kilometres | 11.08 | 9.01 | 6.77 | 8.30 | 9.44 | (15)% |
As indicated in the table, total complaints for each of the three years post the onset of the pandemic are down, but have started an upward trend in 2023. Extrapolating that number into per 100,000 kilometres travelled provides a normalized comparison given the levels of service on the road varied significantly over the period. Consistent with the total complaints, the complaints per 100,000 kilometres for 2023 is approximately 15% less than pre-pandemic levels.
Notwithstanding the lower numbers of complaints in all categories as compared to 2019, there are a number of areas identified as potential trends that need to be addressed.
As compared to 2019, driving related Operator complaints in 2023 declined by 8%, with decline in most categories tracked. The makeup of complaints per category also remained relatively consistent over the period, notwithstanding the differing operating conditions in each of the years. The most significant change over the four year period occurred in the speeding category, with the number of complaints continuing to be high in 2023. Further analysis of these complaints identified that the majority involved areas where speed limits were reduced to 40 kmh. Communication continues to be provided to Operators detailing the routes affected by these speed limit reductions, and reminders have been shared where appropriate. Complaints of this nature will be closely monitored going forward. While the number of complaints is not significant, the doubling in the total complaints in the “idling” category is attributed to the increased need for buses to sit at stops as directed by Dispatch in order to maintain schedule adherence.
Total complaints with respect to ‘service received from the Operator’ has also remained lower than pre-pandemic levels for each of the years, however concerning trends have been noted in both the driver attitude and passenger treatment categories. Further analysis of this category supports the assertions set out earlier in this report with respect to the decline in civil discourse in 2023.
While not all complaints are investigated, they are tracked for Operators who are trending and/or have numerous complaints, and in those cases follow up with the Operator takes place.
In the case of complaints alleging a significant Operator performance issue, an investigation is completed, which can include any or all of the following; interview with the Operator and complainant, assessment of AVLC data, review of the bus’ audio/visual system (noting there is a strict protocol for accessing the system recordings). It should be noted that contacts received from customers are based on the customer’s perception of the incident, and are not always consistent with what actually occurred. In all situations, when requested, a response regarding the assessment is provided to the customer who filed the contact.
Operator performance compliments are also tracked and trended. The chart below sets out the trend in Operator compliments over the period of 2019 through 2023. The significant variance in total complaints versus total compliments reinforces the earlier commentary that customers are far more likely to call and complain when they receive poor service versus offer a compliment for good service.
Total Operator Compliments by Category 2019-2023
| Operator Performance | 2019 | 2020 | 2021 | 2022 | 2023 | % Change |
| Attitude/Treatment | 213 | 240 | 114 | 132 | 145 | (32)% |
| Presentation | 1 | 2 | 1 | 2 | 0 | (100)% |
| Total | 214 | 242 | 115 | 134 | 145 | (32)% |
| Per 100,000 riders | 0.87 | 1.91 | 1.39 | 1.00 | 0.79 | (9)% |
Compliments and expressions of gratitude are shared directly with employees where possible, as well as through postings on internal screens and quoted in the employee newsletter.
Voice of the Customer survey results in the case of the Operator performance categories, provide a somewhat differing perspective.
2018 & 2023 Voice of the Customer Results
| % Agree | |||
| Voice of the Customer Statement | 2018 | 2023 | Area of Focus |
| · The bus is well driven | 89% | 87% | Green |
| · Bus drivers are helpful and courteous | 79% | 83% | Green |
| · Bus drivers are knowledgeable about the transit system | 86% | 86% | Green |
Results in the table above clearly indicate a high level of satisfaction with Operator performance in 2023, both with respect to the manner in which the bus is operated as well as the manner in which the Operator interacts with the customer. These results further the assertion that customers are much less likely to contact a service provider with reports of a positive experience. These results do not in any way negate the complaints received throughout the year, rather they highlight the fact that while negative interactions and experiences do occur on the service, the majority of customers are satisfied with the service provided by Operators.
Service Safety
The tables below set out the total number of motor vehicle accident (MVA) reports for each year for the period of 2019 through 2023. The numbers in this table represent all motor vehicle accidents that were reported in the given year, it is important to note that not all accidents result in a collision/injuries, nor do they all result in damage to a vehicle or an interruption in service.
Summary of Motor Vehicle Accidents – On Road 2019-2023
| Description | 2019 | 2020 | 2021 | 2022 | 2023 | Area of Focus |
| Number of reports | 369 | 293 | 315 | 416 | 353 | |
| · Preventable | 152 | 143 | 149 | 168 | 180 | Red |
| · Non-Preventable | 217 | 150 | 166 | 248 | 173 | Green |
| Total per million km | 27.5 | 23.3 | 24.6 | 31.7 | 24.6 | |
| Per 100,000 service hours | 56.3 | 49.2 | 51.6 | 67.3 | 51.8 | |
| Mean km between reports | 34,882 | 42,835 | 40,589 | 31,553 | 40,606 | |
| Year over year percent change | 2% | 18% | (5)% | (22)% | 29% |
The table above provides a breakdown between preventable and non-preventable motor vehicle accidents in each year. Non-preventable accidents are those in which there is nothing the Operator could have done to avoid it. This category is monitored to identify if there are types of accidents that may be able to be mitigated going forward. In 2023, 42% of non-preventable accidents involved a bus being sideswiped or hit from behind, which are generally the result of the driver of the other vehicle being inattentive and/or unaware of required clearances. All bus Operators complete defensive driving training every three years; however, avoiding accidents of this nature is virtually impossible.
Accidents deemed as preventable are those where the Operator could or should have taken measures to avoid the accident. The causes of preventable accidents are closely monitored for trends, and in the event any are identified, the Operator training programs are reviewed in order to assess whether changes or additions need to be made. In the cases where a specific Operator is trending, additional training and/or a ride around with a training supervisor is arranged in order to mitigate further accidents going forward. In 2023, 67% of the preventable accidents were classified as “clearance” issues where objects or other vehicles were struck by the bus. As this trend emerged in 2019, the new operator training program was amended in 2020 to include additional time driving in a training course focusing on clearance issues.
Additional analysis of the preventable accidents identified that the majority are occurring with Operators having less than two years driving experience. The increase in preventable accidents is believed to be directly related to the current Operator complement makeup, of which approximately 33% have less than two years’ experience given the rapid rate of hiring over the past 24 months. The increased rates of preventable accidents within this group could also be related to the elimination of the 2,000 hours of driving experience with requisite license from the Operator posting in 2019. This change was made given difficulties with filling Operator positions, and the New Operator training program was altered to include additional driving time.
MVAs are closely monitored and trended throughout the year, and communication programs are undertaken to provide Operators with quick tips for mitigating the most common causes. Additionally, Operators who have experienced multiple incidents are provided with refresher training targeting areas of concern.
Passenger falls are an example of motor vehicle accidents that don’t necessarily involve a collision. These accidents are closely monitored and trended as they are the most likely to result in an injury to the passenger. The following table provides a summary of the passenger fall incidents recorded in each of the past four years, broken down between those that occurred while the bus was in motion, and those that occurred when the bus was stationary (e.g. during boarding or alighting).
Summary of Passenger Falls – 2019-2023
| Description | 2019 | 2020 | 2021 | 2022 | 2023 | Area of Focus |
| In motion | 26 | 14 | 27 | 43 | 49 | Red |
| Stationary | 17 | 9 | 13 | 28 | 27 | Orange |
| Total | 43 | 23 | 40 | 71 | 76 | |
| Per million km | 3.2 | 1.8 | 3.1 | 5.4 | 5.3 | |
| Year over year percent change | 3% | (43)% | 71% | 73% | (2)% |
The majority (78%) of passenger falls in 2023 were deemed non-preventable meaning there was nothing the Operator could have done to prevent it. In most cases, these types of falls are the result of a passenger not holding on to the hand-hold or stanchion while standing on the bus. Should the Operator need to quickly apply the brakes, or undertake a maneuver to avoid another vehicle, a passenger that is not holding on is likely to fall. Given there has been no real decline in these accidents since 2022, a communications campaign was undertaken reminding riders to hold on while standing and additional communications will be provided in 2024.
The nature and extent of accidents/incidents are reflective of a number of factors including:
- changing and severity of weather conditions;
- increased road congestion and issues of road conditions; and
- heightened service and customer service expectations.
All passenger fall reports are reviewed, including, as warranted, accessing audio/visual system recordings to investigate the event, all of which is shared with the Commission’s adjuster and legal counsel. The management of accidents/incidents is critical to providing passengers with a safe trip as well as mitigating risk and liability. In terms of cost and risk, the vast majority of the reported accidents/incidents are minor in nature reflecting in part the broad definition of what constitutes an accident/incident.
The other aspect of safety that is measured from a customer perspective is the feeling of safety from unwanted contact/communication while waiting for and/or riding the bus as well as experience of unwanted conversation/contact while waiting for and/or riding the bus. The Voice of the Customer survey results relating to these questions is set out in the table below.
2018 & 2023 Voice of the Customer Results
| % Agree | 2023 | ||||
| Voice of the Customer Statement | 2018 | 2023 | Male | Female | Other |
| · I feel safe riding the bus | 89% | 76% | 82% | 70% | 87% |
| · I feel safe waiting for the bus | 82% | 72% | 77% | 67% | 69% |
| · I have experienced unwanted conversation/contact while riding the bus | 41% | 40% | 35% | 43% | 37% |
| · I have experienced unwanted conversation/contact while waiting for bus | 38% | 39% | 32% | 45% | 41% |
As the table indicates, customer’s perception of safety both while riding and waiting for the bus have declined substantially, while the actual experience of unwanted conversation/contact have remained consistent with the previous survey. Breaking the responses down further by gender reveals that respondents who identified as female feel the least safe both while riding and waiting for the bus and have also experienced the most unwanted contact/conversation.
In 2023, an additional set of questions were added to the survey in an effort to gain a better understanding of safety perceptions. As set out in the table below, customers were asked to score their feelings of safety from crime and/or harassment in a number of locations, the percentage scores indicate those who responded with feeling safe to very safe.
2018 & 2023 Voice of the Customer Results
| Voice of the Customer Statement | 2023 | Male | Female | Other |
| · I feel safe while onboard the bus | 77% | 82% | 70% | 87% |
| · I feel safe in the supermarket or grocery store | 87% | 90% | 85% | 87% |
| · I feel safe while waiting at a bus stop | 71% | 77% | 67% | 69% |
| · I feel safe while on the sidewalk in my neighbourhood | 80% | 82% | 76% | 77% |
As the table illustrates, perceptions of safety both while waiting for and riding the bus are somewhat lower than comparable scenarios in the general community. Breaking the data down by gender again indicates that those respondents identifying as female have the lowest feelings of safety in scenarios.
Administration continues to participate on the Safe Cities for Women Taskforce and looks forward to the establishment of a workplan for 2024 that will work toward enhancing the feelings of safety for women in the community.
Access to London Transit Information
Customers and the public at large have a number of options to interact with London Transit. Those looking for dialogue, or some form of response, can use the customer service phone line or email. Given emails can be directed at any member of London Transit administration, the total emails received and responded to are not tracked. Calls into the customer service department are tracked and trended against previous years’ experience. The table below sets out the total incoming calls to the customer service line in each of the years 2019 through 2023.
Summary of Customer Access – LTC Customer Service Line
| Description | 2019 | 2020 | 2021 | 2022 | 2023 | % Change |
| Information line – answered calls(1) | 87,972 | 70,520 | 60,152 | 79,009 | 79,344 | (9.1)% |
| Interactive voice response(2) | 183,589 | 123,059 | 109,566 | 114,341 | 118,981 | (38.0)% |
| Calls per million rides | 0.011 | 0.015 | 0.020 | 0.015 | 0.011 | 31.3 % |
- Information Line statistics are for the hours of 6a.m. – 10p.m. Monday through Friday and 8:30a.m. – 4:30p.m. on weekends and statutory holidays. Service information provided by staff is based upon real-time information. Staff also assists with trip planning and answers other common questions.
- Interactive Voice Response (IVR) – IVR is a phone system that utilizes voice recognition technology to assist customers with providing real-time information by stop for conventional transit.
As indicated in the table, the total number of calls to both the information line and the interactive voice response did decline through the pandemic period; however, the 2022 and 2023 data indicates an increase toward pre-pandemic levels.
Other ways in which customers and the public at large can stay connected with London Transit is through the website where information about the service in general as well as information regarding Detours and Stop Closures can be found. For the most accurate information with respect to the next bus arrival, riders are directed to stay informed through the Infoweb real-time site; detour and stop closure alerts can also be found on this site. Additionally, onboard posters for major campaigns and a corporate Facebook page is also maintained that provides general news and updates relating to our services.
In addition to the more-static information discussed above, an interactive corporate X (formerly Twitter) account is utilized to provide updates with respect to service as well as to draw attention to specific information contained on the corporate website.
The table below sets out a summary of the visits to the London Transit website, Infoweb real-time, corporate Facebook page and the total X impressions from the corporate accounts for the years 2019 through 2023.
Summary of Customer Access – London Transit Website & Socials
| Description | 2019 | 2020 | 2021 | 2022 | 2023 | % Change |
| Website – main site visits(1) (millions) | 1.647 | 1.024 | 0.870 | 1.072 | 1.301 | (21.0)% |
| Website – Infoweb real-time(1) (millions) | 0.518 | 0.324 | 0.318 | 0.463 | 0.584 | 12.7 % |
| Facebook visits | 0.072 | 0.151 | 0.060 | 0.062 | 0.101 | 40.3 % |
| X (formerly Twitter) Impressions(2) | 1.466 | 0.980 | 0.422 | 0.421 | 0.626 | (57.3)% |
| Site visits per million rides | 0.151 | 0.195 | 0.202 | 0.151 | 0.142 | (5.8)% |
- The numbers included in these items are based on Google Analytics sessions. A session is defined as the amount of time a user is actively engaged with the site, and all usage within that engagement is measured as one session.
- X impressions represent a total of all the times posts originating from the corporate account have been seen.
Consistent with the calls to the information line, website visits, although down in number, have returned to pre-pandemic levels in terms of visits per million rides, these indicate the continued reliance on this source of information for riders throughout the pandemic as procedures and service levels changed.
The following table provides an overview of the makeup of the various methods that customers and the public can utilize to find information with respect to public transit services. It should be noted that some information is limited to only one source (e.g. Commission agendas limited to corporate website), and as such, the addition of alternative methods of interaction may not directly impact others. The table below sets out the percent make-up of the various methods of interaction between LTC and the public at large.
Percent Make Up of Interaction Methods
| Percent Make Up | 2019 | 2020 | 2021 | 2022 | 2023 |
| Information line – answered calls | 2.2% | 2.7% | 3.3% | 3.6% | 2.8% |
| Interactive voice response | 4.6% | 4.6% | 5.9% | 5.2% | 4.2% |
| Website – main site visits | 41.4% | 38.3% | 47.3% | 48.5% | 46.3% |
| Website – Infoweb real-time | 13.0% | 12.1% | 17.3% | 20.9% | 20.8% |
| Facebook page visits | 1.8% | 5.6% | 3.3% | 2.8% | 3.6% |
| X (formerly Twitter) Impressions | 36.9% | 36.7% | 22.9% | 19.0% | 22.3% |
| Total | 100.0% | 100.0% | 100.0% | 100.0% | 100.0% |
The use of the Customer Service line, the website and X continue to represent the majority of customer interactions with London Transit in 2023. In addition to the above access points, the London Transit currently provides approximately 50,000 ride guides and Route Schedules remain available on the London Transit website in a printable format for those wishing a hard copy.
The Voice of the Customer survey in 2023 also included a number of questions relating to customer interactions with Customer Service Representatives as well as where they find information about the service. The following table provides a comparison of the responses to the 2023 survey and a comparison to the 2018 survey.
2018 & 2023 Voice of the Customer Results
| % Agree | |||
| Voice of the Customer Statement | 2018 | 2023 | Area of Focus |
| · Customer service reps are helpful & courteous | 82% | 69% | Orange |
| · My issues are addressed in a timely manner | 66% | 72% | Green |
| · It is easy to find out if buses are running on schedule | 67% | 58% | Red |
| · It is easy to get information about LTC services and schedules | 76% | 53% | Red |
As the table sets out, there has been a decline in three of the four statements relating to customer service and access to information when compared to the previous survey, all of which have been identified as areas of focus. As discussed earlier in this report, there has been a noticeable decline in civility of customers when speaking with Customer Service Representatives. Unfortunately in many cases, customers are calling to complain about service-related issues (full bus, late bus, etc.) for which there is no explanation that is deemed satisfactory to the customer. It is anticipated that the discrepancy between service levels and demand, and the organization’s limited ability to address same has led to this decline in satisfaction with Customer Service Representative’s helpfulness.
With respect to access to information, one of the key communication campaigns for 2024 will be an awareness campaign directing customers where to go for information relating to services and on-time performance. In addition, as set out in Staff Report #7 dated February 28, 2024, the communication around stop closures and construction detours has been enhanced to provide additional information to riders about detour periods and where they should go to catch a bus in the event a specific stop is closed. Administration will continue to assess options and opportunities to enhance the reach of corporate communications going forward noting this is the focus of a workshop in the development of the 2024-2027 Business Plan.
Going Forward
Feedback received in 2023 through the various methods discussed in this report will be utilized as input into the future Conventional Transit Service Plans and the 2024-2027 Business Plan.
Recommended by:
David Butler, Manager of Operations Administration
Caroline Roy, Manager of Corporate Communications
Craig Morneau, Director of Fleet & Facilities
Shawn Wilson, Director of Operations
Concurred in by:
Kelly S. Paleczny, General Manager