Staff Report #5
February 23, 2022
To All Commissioners
Re: COVID-19 Ridership Impacts
Recommendation
The report be NOTED and FILED.
Background
As set out in the Commission’s 2020 Annual Report, the pandemic declaration in March of 2020 and associated lockdown measures that followed resulted in a significant decline in transit ridership on both the conventional and specialized services. Each new wave of the pandemic has resulted in varying levels of public health measures, including lockdowns in some cases. This report is provided to the Commission as a regular update with respect to the impacts the pandemic has had on transit ridership.
Conventional Transit Ridership
The organizational philosophy adopted at the onset of the pandemic with respect to service levels was to ensure that all areas of the city that were served by transit would continue to be served, albeit at lesser frequencies based on employee resource availability.
The graph below provides an overview of the ridership levels on the conventional service for 2021 and 2022 to date with comparative data for 2020, both as a percentage of what would normally be expected in each month noting the numbers are based on actual boardings as counted by the automatic passenger counters on buses. The bars are coloured to match the Provincial colour schemes associated with the various stages of lockdown as noted below:
Green Prevent – no, very limited restrictions in place
Yellow Protect & Stage 3 under the current re-opening plan – very limited restrictions in place
Orange Restrict & Stage 2 under the current re-opening plan – limited restrictions in place
Red Control & Stage 1 under the current re-opening plan – numerous restrictions in place
Grey Lockdown – full lockdown restrictions in place
The colour blue in the graphic is used for January and February 2020 given the pandemic declaration had not occurred at that point in time. Bars that are striped indicate a change during the month from the base colour to the striped colour.
2020, 2021 and 2022 Conventional Transit Ridership as a Percentage of Normal
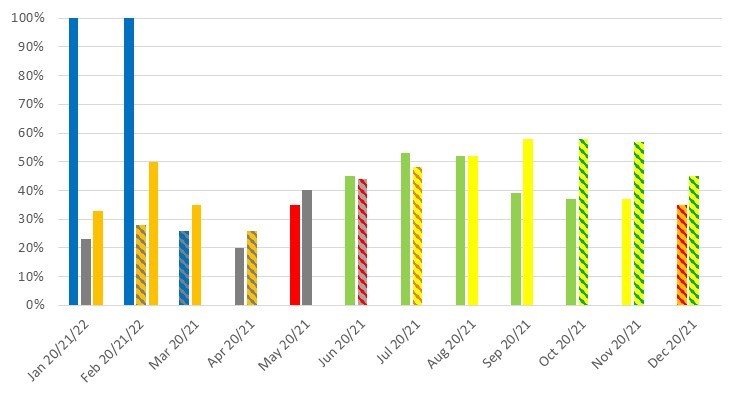
The conventional transit service has been operating at approximately 90% of normal service hours for each service period since September 2020. In early December, due to resource issues, a number of reductions in service were introduced to provide for a more reliable service overall and avoid daily run cancellations often made at the last minute. Effective December 6, 2021, Routes 102, 104 and 106 ceased operating on weekdays and effective December 11, 2021 Routes 90 and 91 ceased operating on weekends only. These reductions were selected given the cancelled routes operate on corridors where other routes also operate, ensuring that public transit service would be maintained on all corridors, though at a lesser frequency.
In late January, students at Western began to return to campus, with the remainder of students scheduled to return at the end of February. In light of this return, routes 102 and 106 resumed weekday operation on February 7. In addition, the weekend service on Routes 90 and 91 resumed operating on weekends beginning February 6.
The earlier graph clearly depicts the impacts that the various stages of lockdown have on conventional transit service ridership. As indicated in the graph, ridership for December 2021 and January 2022 declined from the previous three months, most likely related to the beginning of the latest pandemic wave and the transition to exams and then on-line learning at the post-secondary institutions, followed by the return to Stage 2 lockdown measures in early January. Ridership in February 2022 to date has rebounded to approximately 50% of normal, and with the return of more students to campus, this trend is anticipated to continue into March.
Specialized Transit Ridership
The graph below provides an overview of the ridership levels on the specialized service for 2021 and 2022 to date, with comparative data for 2020 as a percentage of what would normally be expected in each month. Consistent with the earlier graph, the colours in the various bars are reflective of the stages of lockdown that were in place at the time.
2020, 2021 and 2022 Specialized Transit Ridership as a Percent of Normal
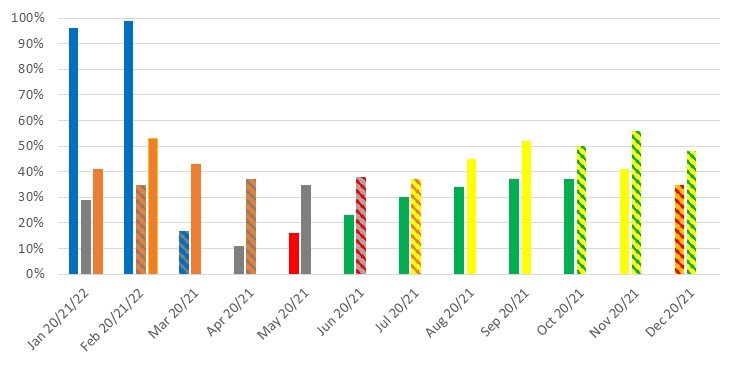
Consistent with the trend on the conventional service, specialized transit ridership also began to climb in September, and reached the highest level since the onset of the pandemic in November. A number of the group activities that traditionally operate in the fall had recommenced, which resulted in an increased demand for services. Beginning in early September, service hours on Sunday were increased in response to increased demand, and in October, evening services on Tuesday and Wednesday were increased to accommodate programs. Demand for service dropped off in late December and through January given the onset of the latest pandemic wave and newly implemented public health measures, which has included the temporary suspension of the aforementioned group activities. As the graph indicates, ridership levels to date for February 2022 were close to reaching the pandemic-period high which was experienced in November 2021. Administration will continue to monitor trip demand by time of day and day of week, and gradually increase service hours to meet demand.
Recommended by:
Katie Burns, Director of Planning
Mike Gregor, Director of Finance
Concurred in by:
Kelly S. Paleczny, General Manager