Staff Report #6
March 6, 2023
To All Commissioners
Re: 2022 Specialized Transit Service Performance Report
Recommendation
That the report be NOTED and FILED.
Background
The 2019-2022 Business Plan, London Transit’s vision is: “The valued and trusted mobility choice for Londoners”. The vision is supported by the mission statement, “Moving Londoners – progressively, reliably and affordably”. The vision and mission statements give direction to five congruent and competing strategic outcomes, namely:
- An integrated, affordable and valued mobility choice
- An engaged, diverse and respectful workplace
- Demonstrated fiscal accountability
- Being open, transparent and understood
- Effective utilization of infrastructure
Service performance is measured in terms of fiscal accountability (efficiency), service (effectiveness and quality), and communication (accuracy and quality of information provided).
While 2022 saw relief from most pandemic-related restrictions, it was not immune from pandemic-related impacts; the two most significant of which were supply chain and labour market. While transit riders began to return to pre-pandemic travel patterns and expectations at increasing rates, the ability of the organization to respond with increased service levels to better match the increased demand was significantly hampered.
The specialized service is operated under a contract which covers the provision of vehicles and drivers; trip booking, scheduling, and customer service is handled by London Transit employees. Similar to the issues faced on the conventional service, the service contractor experienced both supply chain and labour market impacts. The delivery of vehicles ordered to allow for the provision of additional service levels was delayed into early 2023 and difficulties recruiting and onboarding drivers required to increase service levels was a challenge throughout 2022 and continues today. Administration continues to work closely with the contractor to ensure appropriate resources are being applied to the recruitment and onboarding of new drivers to ensure service improvements can continue to be implemented through the remainder of 2023.
While service levels were able to be increased through 2022, they did not reach pre-pandemic levels, notwithstanding the significant increases in service demand. The differential between the service levels operating and those required to meet the demand negatively impacted a number of the measures utilized to assess the specialized transit service performance in 2022.
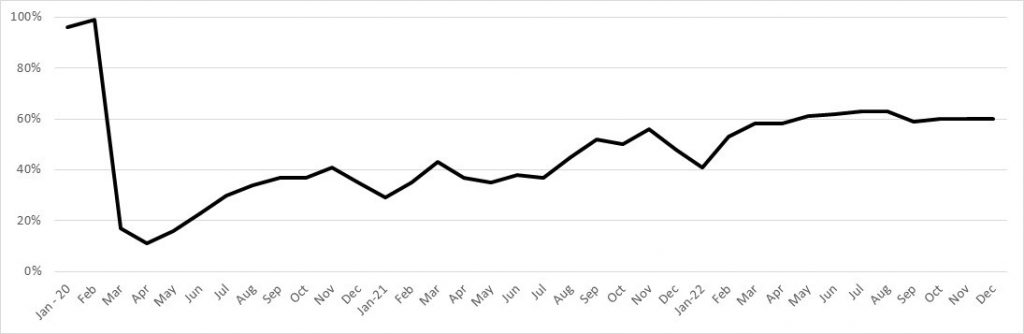
The following chart provides an overview of the ridership levels experienced throughout the pandemic period. As depicted in the chart, subsequent to the pandemic wave in early 2022, ridership levels rose and then remained steady at the highest levels since the onset of the pandemic, noting that ridership levels would have been higher had the service levels been able to be adjusted to meet demand.
Specialized Transit Ridership as a Percentage of Pre-Pandemic (2019) Levels
Specialized Transit Service – Efficiency
The following table provides a summary of ridership and revenue service hours actual to budget performance for 2022 (unaudited). Actual ridership and service provided, as well as the related measures varied significantly from budget.
2022 Ridership and Service Hours – Actual versus Budget (unaudited)
| Description | Actual | Budget | Amount Better (Worse) | Percent Better (Worse) |
| Revenue service hours (000’s) | 119.1 | 152.1 | (33.0) | (21.7) % |
| Ridership ( 000’s) | 222.9 | 280.7 | (57.8) | (20.6) % |
| Rides per revenue service hour | 1.9 | 1.9 | — | — % |
As indicated in the table, the service level adjustments that were included in the 2022 budget were not able to be implemented as planned, and as such, ridership levels were lower than anticipated.
The following table provides comparisons in the various ridership and service hour measures over the past four years.
Ridership and Service Hour Comparisons – 2019 through 2022
| Description | 2019 | 2020 | 2021 | 2022 | % Change Over Period |
| Revenue service hours (000’s) | 147.1 | 129.9 | 122.2 | 119.1 | (19.0)% |
| Ridership (000’s) | 333.4 | 157.1 | 168.6 | 222.9 | (33.1)% |
| Rides per revenue service hour | 2.3 | 1.2 | 1.4 | 1.9 | (17.4)% |
| Registrants | 10,691 | 11,026 | 10,859 | 11,996 | 5.2 % |
Customer Satisfaction
In an effort to gather first-hand feedback from transit riders, the Voice of the Customer survey process was introduced on the specialized service in 2018. This process involves contacting specialized service riders directly for a telephone interview, providing the opportunity to reach customers who may not be inclined to contact customer service with a complaint or compliment. It is a known fact that a customer is more likely to contact an organization when they have had a poor experience versus a good one, and the traditional reliance on customer contacts only to assess overall customer satisfaction was deemed to be unreliable. The Voice of the Customer allows customers to rate each area of service on their perception of how it meets their needs. Unfortunately, the Voice of the Customer survey process was placed on hold during the pandemic period, so there is no current data to provide in this report. The Voice of the Customer survey is scheduled to resume in 2023 and results will be included in this report going forward.
In addition to the Voice of the Customer surveys, customer satisfaction levels with service performance are measured through tracking both the number and nature of customer contacts received via email, social media and phone. When considering these numbers, it is important to recognize that not all contacts are investigated and as such, cannot all be confirmed as accurate. Contacts that are serious in nature or those in which the customer requests a response are all investigated.
The table below sets out a breakdown of the number of service complaints over the four year period by category, as well as a percentage change in each category over the period.
Total Service Performance Complaints by Category 2019-2022
| Complaints – Service | 2019 | 2020 | 2021 | 2022 | % Change |
| Accessibility | 6 | 5 | 10 | 19 | 217 % |
| Early Schedule | 6 | 5 | 0 | 6 | –% |
| Late Schedule | 10 | 3 | 6 | 29 | 190 % |
| Missed Passenger | 12 | 7 | 0 | 4 | (67)% |
| No Show | 57 | 18 | 13 | 16 | (72)% |
| Routing | 3 | 1 | 1 | 5 | 67 % |
| Service received | 98 | 54 | 51 | 101 | 3 % |
| Trip Availability | 22 | 5 | 3 | 61 | 177 % |
| Warning Letter Response | 1 | 2 | 0 | 1 | –% |
| Total | 215 | 100 | 84 | 242 | 13 % |
| Per 1,000 riders | 0.65 | 0.64 | 0.49 | 1.04 | 60 % |
Consistent with the reporting above, the total number of service performance complaints by category are set out in the table above for transparency purposes. While direct number comparisons to previous years is problematic, the total complaints per 1,000 riders provides a better comparison. As the table indicates, the total complaints per 1,000 riders declined slightly in 2020 and 2021, but rose above pre-pandemic levels in 2022. During 2020 and 2021, an organizational decision was made to carry a maximum of two customers per vehicle given the ongoing pandemic, which resulted in a direct trip for most customers, eliminating or greatly reducing the chances of a poor rider experience. 2022 saw the return of riders to the service at a rate higher than what was able to be accommodated given the inability of the contractor to increase service levels as quickly as required to respond to demand. This is supported by the increase in complaints regarding trip availability.
The top category of complaints over the period has remained “service received”, which includes issues such as length of trip, drop off locations, pick-up locations, as well as other complaints that may encompass more than one of the categories listed in the table above. A significant number of the complaints in this category in 2022 were directly tied to the nature and extent of construction projects and related road closures and detours in place throughout the city. Preferred pick-up and drop off locations in many cases needed to be altered, and the length of trips was extended noting traffic in general was slower throughout the city. The other common theme of complaints in this category in 2022 related to drivers not going to the door of the pick-up location to assist the customer to the vehicle. In all cases, these complaints were shared with the Contractor and appropriate follow up with the driver was undertaken.
The increase in late schedule complaints over previous years is directly tied to the availability of drivers through much of 2022. When a driver calls in sick on the day of work and no substitute is available, trip assigners make every effort to adjust the manifests of the remaining drivers to accommodate every trip that had been booked for the day. Depending on the number of trips required to be moved, this will have a negative impact on the on-time reliability of the service as accommodating the trip takes priority over ensuring the most efficient schedule. Unfortunately, driver shortages of this nature occurred regularly throughout 2022, and while administration did everything possible to accommodate all of the trips booked with fewer vehicles, it did result negatively on on-time performance and length of time on the vehicle.
Impressions of Driver Performance
Consistent with service related contacts, customer contacts (complaints and compliments) regarding Driver performance are also tracked and trended. Performance results for 2019 through 2022 with respect to Driver complaints are set out in the following table.
Total Operator Complaints by Category 2019-2022
| Complaints – Operator Performance | 2019 | 2020 | 2021 | 2022 | % Change |
| Driving Unsafe | 21 | 12 | 22 | 10 | (52)% |
| Attitude/Treatment | 89 | 90 | 89 | 74 | (17)% |
| Total | 110 | 102 | 111 | 84 | (24)% |
| Per 1,000 riders | 0.3 | 0.6 | 0.7 | 0.4 | 33 % |
Of note in the table above, the number of Operator complaints remained relatively consistent with previous years, but dropped in 2022. Further analysis of the 2022 complaints revealed that the reduction occurred in complaints that were considered pandemic-related (e.g. pandemic related restrictions, policies, etc.) which were the predominant theme in 2020 and 2021 noting the frequent changes in procedures and protocols during that period resulted in a heightened level of anxiety for both Operators and customers, which in numerous cases, led to verbal exchanges that were reported to customer service and classified in the attitude/treatment category. In the case of complaints alleging a significant Driver performance issue, all information is forwarded to the contractor for investigation and follow-up. All contacts received relating to the specialized service are followed up on by administration.
The chart below sets out the trend in Operator compliments over the period of 2019 through 2022.
Total Operator Compliments by Category 2019-2022
| Compliments – Operator Performance | 2019 | 2020 | 2021 | 2022 | % Change |
| Driving | 0 | 0 | 0 | 1 | 100 % |
| Attitude/Treatment | 29 | 7 | 20 | 28 | (3)% |
| Total | 29 | 7 | 20 | 29 | —% |
| Per 1,000 riders | 0.08 | 0.04 | 0.11 | 0.12 | (50)% |
As the chart above indicates, Operator compliments received for the specialized service are limited, which underscores the value of the Voice of the Customer surveys as an alternative way to gather customer perspectives with respect to the service being provided. The total compliments in 2022 rebounded to typical levels.
Going Forward
This report will be shared with the Accessible Public Transit Service Advisory Committee as input into discussions relating to priorities for future years. The details of this report will also be utilized in the preparation of the 2023-2026 Business Plan.
Recommended by:
Brandon Goldstone, Manager of Service Integration
Shawn Wilson, Director of Operations
Concurred in by:
Kelly S. Paleczny, General Manager