Staff Report #6
November 24, 2021
To All Commissioners
Re: COVID-19 Ridership Impacts
Recommendation
The report be NOTED and FILED.
Background
As set out in the Commission’s 2020 Annual Report, the pandemic declaration in March of 2020 and associated lockdown measures that followed resulted in a significant decline in transit ridership on both the conventional and specialized services. Late in 2020, the second wave of the pandemic resulted in public health measures including lockdowns which extended into the first part of 2021, and in April of 2021 the third wave resulted in lockdowns, followed by a fourth wave that, at time of report writing may be building again however the Province continues to have very limited restrictions in place.
Conventional Transit Ridership
The organizational philosophy adopted at the onset of the pandemic with respect to service levels was to ensure that all areas of the city that were served by transit would continue to be served, albeit at lesser frequencies based on employee resource availability. The conventional transit service has been operating at approximately 90% of normal service hours for each service period since September 2020. This service level will continue through the remainder of 2021.
The graph below provides an overview of the ridership levels on the conventional service for 2021 with comparative data for 2020, both as a percentage of what would normally be expected in each month noting the numbers are based on actual boardings as counted by the automatic passenger counters on buses. The bars are coloured to match the Provincial colour schemes associated with the various stages of lockdown as noted below:
Green Prevent – no, very limited restrictions in place
Yellow Protect & Stage 3 under the current re-opening plan – very limited restrictions in place
Orange Restrict & Stage 2 under the current re-opening plan – limited restrictions in place
Red Control & Stage 1 under the current re-opening plan – numerous restrictions in place
Grey Lockdown – full lockdown restrictions in place
The colour blue in the graphic is used for January and February 2020 given the pandemic declaration had not occurred at that point in time. Bars that are striped indicate a change during the month from the base colour to the striped colour.
2020 and 2021 Conventional Transit Ridership as a Percentage of Normal
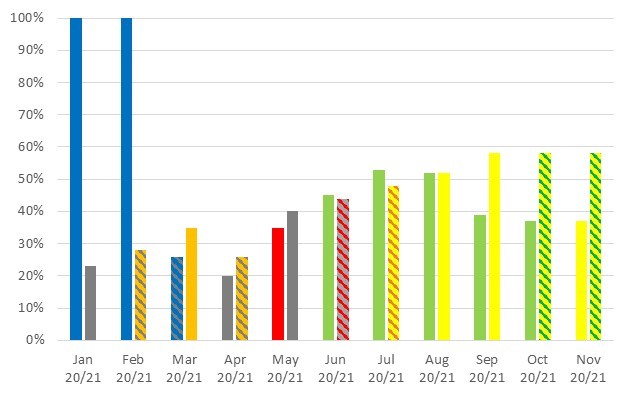
The graph clearly depicts the impacts that the various stages of lockdown have on conventional transit service ridership. As indicated in the graph, ridership for September 2021 has jumped significantly as compared to that for the same month in 2020, and has held steady through October and November. The return of post-secondary students, coupled with employees beginning to transition back to the workplace has resulted in ridership loads that are significantly higher than what has been experienced over the past 18 months.
Many of the mainline routes, which serve Western University, Fanshawe College and/or Downtown, are experiencing crowding conditions during the weekday peak periods and into the early evening. Routes 2, 9, 10, 12, 13, 15, 17, 25, 27, 31, 93, 102 & 106 are consistently seeing high passenger volumes throughout the day. Articulated buses will continue to be assigned to these routes where possible in an effort to address the crowding conditions. Employee resources that would typically be utilized to assign trippers to the affected routes are limited at this time due to the ongoing pandemic and related restrictions. This situation is monitored on a daily basis, and in the case where employees are available, tripper buses will be added to relieve pressure on the routes experiencing the heaviest loads.
Specialized Transit Ridership
The graph below provides an overview of the ridership levels on the specialized service for 2021, with comparative data for 2020, both as a percentage of what would normally be expected in each month. Consistent with the earlier graph, the colours in the various bars are reflective of the stages of lockdown that were in place at the time.
2020 and 2021 Specialized Transit Ridership as a Percent of Normal
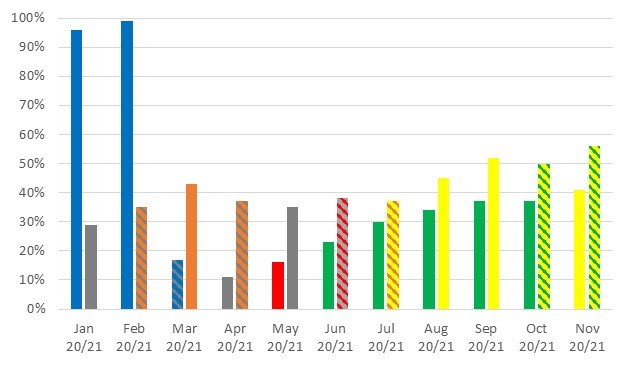
Consistent with the trend on the conventional service, specialized transit ridership also began to climb in September, and has reached the highest level since the onset of the pandemic in November. A number of the group activities that traditionally operate in the fall have recommenced, which is increasing demand for services. Beginning in early September, service hours on Sunday were increased in response to increased demand, and in October, evening services on Tuesday and Wednesday have been increased to accommodate programs. Administration will continue to monitor trip demand by time of day and day of week, and gradually increase service hours to meet demand.
Recommended by:
Katie Burns, Director of Planning
Mike Gregor, Director of Finance
Concurred in by:
Kelly S. Paleczny, General Manager