Staff Report #7
January 25, 2023
To All Commissioners
Re: 2023 Service Improvement Plan
Recommendation
That the report be NOTED and FILED.
Background
The declaration of the global pandemic in April 2020 resulted in significant impacts on public transit services worldwide. The strict public health protocols that were implemented in 2020 resulted in reduced demand for public transit services. Notwithstanding the decreased demand, many in the community continued to rely on London Transit as their mode of transportation. As such, reduced levels of service continued to operate through the pandemic period. Given the uncertainties with respect to how long the pandemic would impact demand for public transit, the Commission deferred the implementation of the planned 2020 service improvements.
In mid-2020, administration completed a Pandemic Response Plan intended to guide the organization through the pandemic period and beyond, with the underlying intent of maintaining ridership during the pandemic to the extent possible, and recovering ridership post pandemic. In addition, the Pandemic Response Plan included specific policies and procedures required in order to ensure the ongoing safety of LTC bus operators and riders as the services continued to operate.
The impacts of the pandemic on demand varied significantly between the conventional and specialized services, as did the approach to maintaining services. The pandemic response and planned path forward for the services is discussed in greater detail in each of the separate sections below.
Conventional Transit Service
The graph below illustrates the impacts on ridership on the conventional transit service for the years 2020 through 2022.
Conventional Transit Ridership as a % of Pre-Pandemic Levels Jan 2020 through Dec 2022
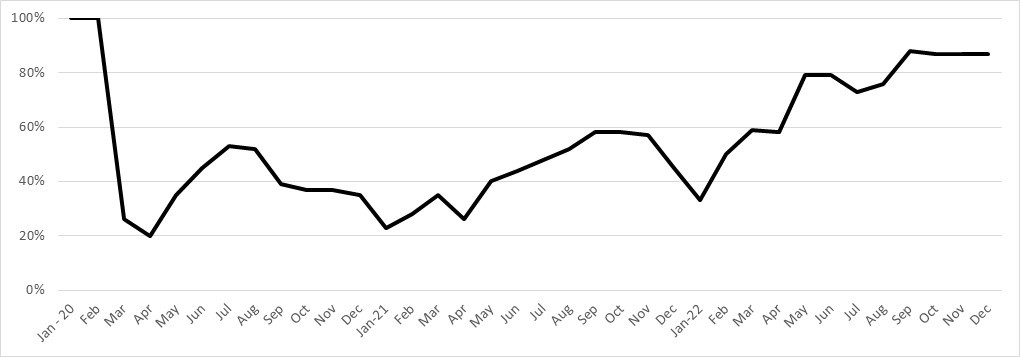
As the graph illustrates, overall, 2020 had the lowest overall ridership on the conventional service, ranging from a low of 20% to a high of 52% of pre pandemic levels. During 2020, service levels were reduced to match the available employee resources noting absentee rates climbed significantly during the period due to both employee sickness as well as the need to be absent to take care of family. In addition, a number of employees chose to retire during this period, and they were not replaced at the time due to pandemic-related restrictions. An underlying principle in the Pandemic Response Plan for the conventional service was to ensure that every area of the City that had access to public transit pre-pandemic, would continue to have access during, albeit at less frequency.
In January 2021, in anticipation of ridership continuing to rebound and in the interest of attracting riders back to public transit, the Commission approved administration’s recommendation to proceed with implementing the 18,000 growth hours deferred from 2020. Given ongoing uncertainty with respect to the pandemic impacts on ridership patterns, the recommendation called for adjustments to the improvements that were originally planned for 2020, to be more focused on system-wide improvements that would benefit more current and returning riders. The budget request for service growth was approved by Municipal Council as part of the 2021 budget deliberation, and the service improvements were planned to be implemented in September 2021. Recruitment and onboarding of bus Operators began in April 2021, however class sizes were limited to four due to pandemic-related restrictions. This limit, coupled with the five-week training period for new operators, resulted in complement levels not reaching those required to implement the service improvements. The plan to implement service improvements effective September 2021 was modified to allow for implementation over the period September 2021 through February 2022 as resources became available.
In August 2021, when ridership levels were steadily climbing, the Commission approved the 2022 operating budget, which included another 18,000 hours of service growth, planned to be implemented in the fall of 2022. These service changes were again directed at frequency improvements system wide, as well as service expansion to new areas not currently served. This request was also approved by Municipal Council as part of the budget deliberation process.
As the above graph depicts, another pandemic wave hit in late 2021 and extended through the first quarter of 2022. This wave required pandemic restrictions to be re-implemented, and again slowed the onboarding of the required bus operators for the 2021 service improvements. In addition, the absenteeism associated with this pandemic wave resulted in the inability to increase service levels beyond what was in place.
The signup period beginning May 1, 2022 was set to return to full pre-pandemic service levels and begin to implement the 2021 service improvements (noting the conventional service had been operating at approximately 90% of normal service levels since September 2020). Unfortunately continued higher than anticipated non-attendance rates resulted in numerous runs having to be cancelled during the first week of May. In an effort to ensure a more reliable service for customers, the decision was made to once again cease the operation of the Express Routes 90, 91, 92 and 94 until such time as the available employee complement improved.
Operator recruitment and on-boarding has continued in earnest since April 2021, noting 122 new Operators have been hired. Barring a significant variance in terms of retirements from what is anticipated or any difficulties hiring, Operator complement levels will be at the point they need to return to full pre-pandemic service levels on the conventional service with the February 5, 2023 signup period. Unfortunately, supply chain issues relating to bus parts, coupled with a shortage of mechanics in the Fleet and Facilities department, has resulted in fewer buses being available for service each day. The ability to provide tripper buses, used to alleviate schedule adherence and crowding conditions on specific routes, may be limited by bus and operator availability.
Given the ongoing concerns with employee resource availability, which grew from bus Operators only to include bus mechanics, at the time of 2023 budget approval in August 2023, the Commission opted to forego any requests for additional service growth hours and rather directed administration to utilize 2023 to implement that backlogged service improvements from the previous two years. The table below sets out a high level overview of the outstanding service improvements that are anticipated to be implemented by the end of 2023. The order in which these improvements will be implemented will be dependent upon employee and bus availability.
Outstanding Conventional Transit Service Improvements
| Service Improvement | Anticipated Date |
| · Increased operating frequency on 17 routes | TBD |
| · Implementation of new Express route connecting White Oaks Mall and Fanshawe College | TBD |
| · Additional running time to routes experiencing schedule adherence issues | ASAP |
| · New service to Robin’s Hill Road Industrial Area | TBD |
| · Increased frequency and extended hours from Fanshawe College to Airport | TBD |
| · Implementation of Alternative Service Delivery from Argyle Mall to Innovation Park Industrial Area | Sept/23 |
Administration is continuing to receive customer contacts relating to overcrowded buses, full buses passing stops and schedule adherence issues. These contacts are being closely monitored and analyzed by the planning department so as to ensure that improvements are being scheduled and implemented in a manner that addresses the most problematic routes first.
In addition, as set out in Staff Report #3, dated January 25, 2023, the Commission Work Program includes the completion of the next Five Year Service Plan for the conventional service, which will include detailed analysis of all routes in an effort to address new ridership patterns and demands that have evolved over the pandemic period. The underlying goal of this five-year plan, which will cover the years 2024 – 2028, will be to ensure that transit system network is reflective of current ridership demand, and functions in an effective and efficient manner, with the focus on improved rider experience.
Conventional service levels were maintained at between 70% and 90% of pre-pandemic levels in order to ensure Londoner’s continued to have access to services, but also in an effort to provide the ability for additional distancing onboard vehicles, to alleviate customer concerns about having to sit too close to other riders. Transit systems across Ontario were fortunate to have the Safe Restart Funding program in place, which provided funding from the Provincial and Federal governments to offset the budgetary impacts of the pandemic, including the need to keep service operating notwithstanding the significant declines in ridership. The table below provides an overview of the ridership in the years 2019 through 2023 (noting 2022 is not finalized and 2023 is budget only) as well as the total cost per ride provided on the conventional service.
Conventional Transit Service Total Cost per Ride 2019-2023
| Year | Total Ridership (millions) | Total Cost per Ride |
| 2019 | 24.601 | $ 2.89 |
| 2020 | 10.545 | $ 6.40 |
| 2021 | 8.266 | $ 8.77 |
| 2022* | 14.511 | $ 5.84 |
| 2023* | 20.790 | $ 4.32 |
* 2022 ridership not finalized and 2023 ridership budget only
The Safe Restart funding program ended on December 31, 2022, and at time of report writing, no new program to offset ongoing pandemic related operating budget impacts has been announced. Continuing to implement service changes that will attract riders back to the conventional service is critical going forward as the increased cost per trip during the pandemic period is not sustainable.
Specialized Transit Service
London’s specialized transit service is intended to provide Londoners who, as the result of a disability, are unable to access London’s conventional transit service for some or all of their trips. The specialized service offers a door-to-door service, with drivers providing assistance between the vehicle and the door of the trip origin and destination. Due to this higher level of service, riders must be pre-registered to qualify to book trips, and must call to book their trips in advance of travel.
Specialized transit services are provided in a lift-equipped vehicle, with a capacity for up to six mobility devices and up to ten ambulatory seats. The service is delivered under a brokerage model, where the responsibility for call taking, trip booking, trip dispatching, data analysis and customer service are provided by London Transit employees, and a contract is awarded to a third party for the provision of drivers and vehicles. This model has been employed since the brokerage was established in 1998 based on industry best practices.
The following graph illustrates the impacts on ridership as a percentage of pre-pandemic ridership on the specialized service for the years 2020 through 2022.
Specialized Transit Ridership as a % of Pre-Pandemic Levels Jan 2020 through Dec 2022
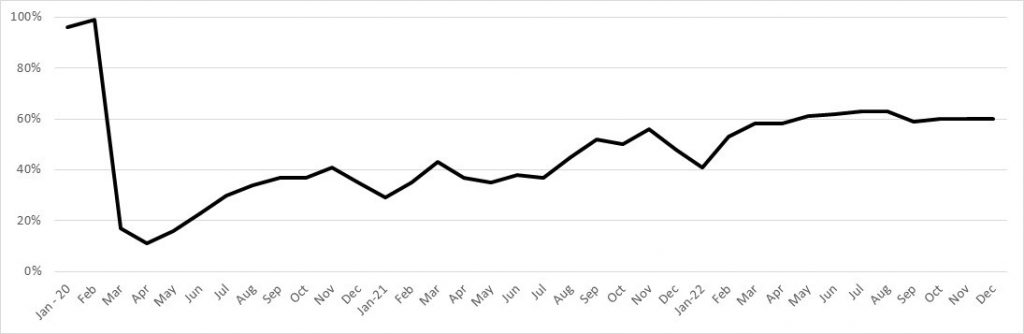
As the graph indicates, the pandemic had a much more significant and sustained impact on the specialized service ridership. This is due in large part to the customers who rely on this service, many of whom chose to only travel when necessary during the pandemic due to health-related concerns. Unlike the conventional service, which operates on specific routes during scheduled intervals, the specialized service schedules change every day based on the trip requirements of the customer base. A base fleet of vehicles is available for each day, and trips are booked until such time as there is no more capacity. Given the pre-booked nature of the service, there can be up to 15% of pre-booked trips cancelled prior to the trip. These cancellations result in capacity that can be utilized by customers calling in the day prior, or even day of travel.
A large percentage of the specialized service customer base rely on the service for transport to medical trips including dialysis treatments that occur three times per week. In an effort to ensure access to these critical appointments remained available, the approach utilized for reducing service levels on the specialized service during the pandemic was to ensure there was enough service on the road to ensure every trip request could be accommodated, and no more than two customers would be on the vehicle at the same time (to allow for distancing). On days with high rates of cancellation, drivers were left sitting with no trips in many cases.
Adjusting service levels on the specialized service is less complicated than the conventional service as no schedules need to be created. On the specialized service, another vehicle is simply added to the daily roster. The only complicating factor is the availability of a driver for the additional vehicle. As such administration provides the contractor with advance notice of when additional vehicles need to be available. In the event the contractor is required to expand their fleet in order to accommodate the additional service, more significant advance notice is provided. Given all trip requests are tracked, analysis of the non-accommodate trips can identify the days and/or times of day that service is not keeping up with demand. This analysis is utilized to determine when to add additional vehicles into the roster.
Given the significant decline in demand, and the ability to accommodate every trip request with the service levels left in place, the 2020 service improvements which consisted of the addition of 6,000 service hours were not implemented.
In 2021, the Commission approved moving forward with the implementation of the additional 6,000 hours from 2020, consistent with the approach taken on the conventional service. The plan was to incrementally increase hours as customer demand warranted through 2021; however, as indicated in the graph, demand did not warrant the addition of service as all trip requests continued to be accommodated. During this period there were some adjustments to the days/times the vehicles were available to better match the demand of the ridership base, but the additional hours were not added.
In 2022, notwithstanding the 2021 hours had not yet been implemented, the Commission approved an operating budget that included another 6,000 hours for the specialized service. This approval acknowledged that while the previous hours hadn’t been implemented, and the demand hadn’t increased back to pre-pandemic levels, the specialized service had a pre-pandemic non-accommodate rate of approximately 4% (15,000 annual trips). These increases were anticipated to be able to help accommodate some of the unmet demand that was anticipated to return once pandemic concerns for riders had waned.
Demand for service began to steadily increase after following the pandemic wave in early 2022, and administration began working with the contractor to increase service levels in response. While this approach was initially adequate to continue to meet most trip requests, service level improvements were not able to keep up with the pace of the increased demand later in 2022. Unfortunately, the employee resource issues impacting the ability to move forward with improvements on the conventional service were also faced by the contractor providing the specialized service. The inability to recruit and onboard drivers fast enough to expand the service, coupled with higher non-attendance rates has resulted in shifts being cancelled on the day of travel. In these cases, LTC administrative staff work to re-allocate riders to vehicles that are operating; however, this can result in service delays for the customer. Vehicle availability has also impacted the contractor in a similar manner that bus availability has impacted LTC, noting the new vehicles that were ordered in early 2022 to allow for service expansion have not yet been delivered. This issue is plaguing specialized transit services across the province.
Administration has worked closely with the contractor to clearly articulate the need for increased service levels to meet the demand, and the contractor has made every effort to recruit and on-board drivers. As drivers are trained and available to be added to the roster, service levels are being adjusted. As indicated earlier in this report, adjustments to specialized service levels can be done more quickly given the nature of the service.
The plan for implementing the outstanding 12,000 service hours on the specialized service is to add shifts as drivers and vehicles become available, increasing the 32 vehicles currently in service on a weekday up to 40 by the end of 2023.
Similar to the conventional service, the impacts on the cost per trip associated with this approach increased significantly over the pre-pandemic cost per trip.
Specialized Transit Service Total Cost per Ride 2019-2023
| Year | Total Ridership | Total Cost per Ride |
| 2019 | 333,410 | $ 27.57 |
| 2020 | 152,400 | $ 57.81 |
| 2021 | 149,900 | $ 64.61 |
| 2022* | 222,400 | $ 42.82 |
| 2023* | 325,900 | $ 39.82 |
* 2022 ridership not finalized and 2023 ridership budget only
Not only does this table illustrate the impacts of service model that remained in operation during the pandemic on cost per trip, it also clearly depicts the cost differential between the two services noting a trip on the specialized service costs approximately nine times that of a trip on the conventional service. Simply continuing to grow this service without checks and balances is not sustainable.
Service Integration
One of the programs included in the Commissions Business Plan and annual work programs to make the costs associated with the delivery of specialized transit services more sustainable is the integration of the two services. Unfortunately, this program was deferred during the pandemic period due to other more critical issues. Over the last number of years, significant investment has been made to make the conventional transit service fully accessible. The service integration project will identify and implement steps to increase the use of the accessible conventional service by specialized service customers where possible. By way of example, the specialized service could be utilized to pick up a customer who does not live close to a conventional transit stop (noting there are still many areas of the city without close access to a conventional transit route), but rather than taking that passenger across the city to their final destination, they would be dropped at the closest conventional transit stop and route that would allow them to complete their trip on the conventional service. While it is recognized that not all trips will be able to be delivered in this manner, the ones that can be will alleviate pressure on the specialized service, and transfer those riders to the conventional service. In order for this program to work effectively, there needs to be adequate capacity on the conventional service to accommodate these trips, which is part of the rationale for the continued increases in service levels on that service.
Another program intended to help alleviate the pressure on the specialized service while at the same time making use of the accessibility features of the conventional service is the non-peak pass program. Every registrant of the specialized service is provided with a pass that allows them to travel on the conventional service during off-peak periods free of charge. As illustrated earlier in the cost per trip tables, every customer trip that is taken on the conventional service versus the specialized saves approximately $35.50 in operating budget expenditure. This approach also provides for greater flexibility for the specialized customer as they can travel when it is convenient for them, without the need to pre-book a trip.
As set out in Staff Report #3, dated January 25, 2023, the Service Integration program has been placed on the 2023 work program to begin this transition.
Summary
Administration will provide updates to the Commission with respect to the progress of the implementation of the additional service hours on both the conventional and specialized services as appropriate.
Recommended by:
Shawn Wilson, Director of Operations
Katie Burns, Director of Planning
Craig Morneau, Director of Fleet & Facilities
Joanne Galloway, Director of Human Resources
Concurred in by:
Kelly S. Paleczny, General Manager