Staff Report #7
August 25, 2021
To All Commissioners
Re: COVID-19 Ridership Impacts
Recommendation
The report be NOTED and FILED.
Background
As set out in the Commission’s 2020 Annual Report, the pandemic declaration in March of 2020 and associated lockdown measures that followed resulted in a significant decline in transit ridership on both the conventional and specialized services. Late in 2020, the second wave of the pandemic resulted in public health measures including lockdowns which extended into the first part of 2021, and again in April of 2021 the third wave resulted in lockdowns that have only recently been modified to Stage 1 of the Provincial Plan on June 11. While lockdown measures began to slowly be lifted in July and again in August, case counts are again beginning to climb, bringing the potential of a fourth wave into focus.
Conventional Transit Ridership
The organizational philosophy adopted at the onset of the pandemic with respect to service levels was to ensure that all areas of the city that were served by transit would continue to be served, albeit at lesser frequencies based on employee resource availability. The conventional transit service has been operating at approximately 90% of normal service hours for each service period since September 2020. This is anticipated to continue through the fall of 2021.
The graph below provides an overview of the ridership levels on the conventional service for 2021 with comparative data for 2020, both as a percentage of what would normally be expected in each month noting the numbers are based on actual boardings as counted by the automatic passenger counters on buses. The bars are coloured to match the Provincial colour schemes associated with the various stages of lockdown as noted below:
Green Prevent – no, very limited restrictions in place
Yellow Protect & Stage 3 under the current re-opening plan – very limited restrictions in place
Orange Restrict & Stage 2 under the current re-opening plan – limited restrictions in place
Red Control & Stage 1 under the current re-opening plan – numerous restrictions in place
Grey Lockdown – full lockdown restrictions in place
The colour blue in the graphic is used for January and February 2020 given the pandemic declaration had not occurred at that point in time. Bars that are striped indicate a change during the month from the base colour to the striped colour.
2020 and 2021 Conventional Transit Ridership as a Percentage of Normal
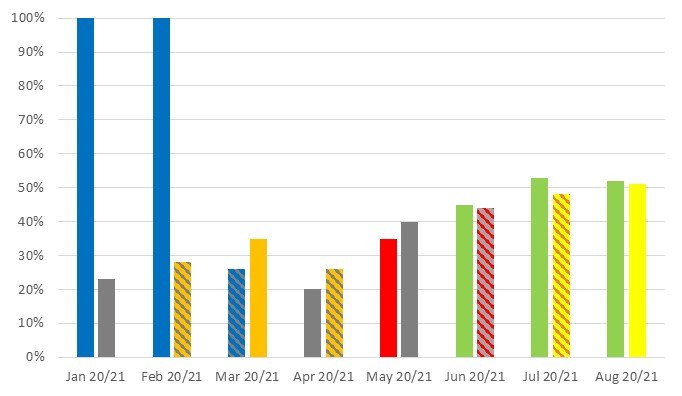
The graph clearly depicts the impacts that the various stages of lockdown have on conventional transit service ridership. As indicated in the graph, ridership for June through August 2021 is on par with the same periods in 2020 when there were no restrictions in place.
With the service levels now in place, and ridership continuing to climb as the Province moves forward with the re-opening framework, a number of routes have experienced increased passenger loads, in some cases, passenger loads are exceeding 50 riders. Articulated buses will continue to be assigned to these routes where possible in an effort to address the crowding conditions. Employee resources that would typically be utilized to assign trippers to the affected routes are limited at this time due to the ongoing pandemic and related restrictions. This situation is monitored on a daily basis, and in the case where employees are available, tripper buses will be added to relieve pressure on the routes experiencing the heaviest loads.
As set out in Staff Report #6 dated August 25, 2021, service levels will return to approximately 90% of 2019 fall service on September 5, 2021. The continued growth in regular ridership, coupled with the return of post-secondary students and the planned return of many employees to the workplace beginning in September, is likely to result in crowding on the service. In preparation for this, a “welcome back” communication campaign has been launched that will encourage riders to allow themselves more time, utilize the real-time system for up to date service information, and to consider alternative routes when possible. In addition, the campaign will continue to touch on the various measures that continue to be in place in an effort to protect both riders and Operators from COVID as well as the measures that riders can take themselves to increase their level of protection.
Ridership data for 2020 cannot be broken down by fare category given fares were waived from March to August of 2020. The chart below provides a breakdown of the ridership by fare category for 2021 and provides the historic breakdown for 2019 (full pandemic-free year) as a comparison.
Conventional Ridership by Fare Category
| 2019 (Normal) | Fare Category | Jan 2021 | Feb 2021 | Mar 2021 | Apr 2021 | May 2021 | Jun
2021 |
Jul
2021 |
| 5% | Cash | 12% | 11% | 10% | 10% | 11% | 11% | 12% |
| 20% | Ticket/Stored Value | 39% | 42% | 41% | 40% | 39% | 41% | 43% |
| 22% | Monthly Pass | 23% | 22% | 21% | 25% | 25% | 21% | 19% |
| 53% | Tuition Pass | 26% | 26% | 28% | 25% | 25% | 27% | 26% |
| 100% | Total | 100% | 100% | 100% | 100% | 100% | 100% | 100% |
The shifts in fare category usage from normal (2019) to 2021 provide insight into the manner in which riders are currently utilizing public transit. Both the cash and ticket/stored value fare category usage have doubled in terms of make-up in 2021 as compared to 2019. This is indicative of riders who are unsure of how often they will be utilizing the service. The monthly pass category has, conversely, remained consistent with 2019, indicating that approximately 25% of ridership is made up of riders that will utilize the service frequently enough in a month to make the monthly pass a better value, these riders tend to be those relying on the service to get to/from work or school. The shift away from monthly pass to tickets and cash in July is typical given this is prime vacation time and many regular riders don’t require a pass for the full month. The decline in the tuition pass category make-up is consistent with the decline in the number of students participating in the programs given the shift to online learning as the result of the pandemic. It is anticipated, given the expected return to campus for most post-secondary students in September that the ridership categories will return to something closer to that of 2019.
These trends will continue to be monitored throughout 2021 in an effort to identify the shifts in fare category make-up and ensure that campaigns designed to regain riders post-pandemic is targeted at the appropriate category of rider.
Specialized Transit Ridership
Specialized services continue to operate at a level that will accommodate all trip requests with a maximum of two passengers per vehicle. This has been achievable primarily due to the decline in demand for the service throughout the pandemic period. Given trips on the specialized service are pre-booked, service can be adjusted in response to demand.
The graph below provides an overview of the ridership levels on the specialized service for 2021, with comparative data for 2020, both as a percentage of what would normally be expected in each month. Consistent with the earlier graph, the colours in the various bars are reflective of the stages of lockdown that were in place at the time.
2020 and 2021 Specialized Transit Ridership as a Percent of Normal
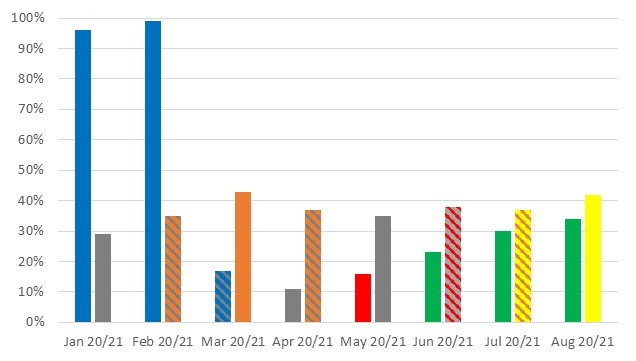
Specialized ridership in 2021 has doubled that of 2020 in the months that were impacted by the pandemic. The ridership increases on this service are also believed to be tied to the more lenient closures during the 2021 lockdowns, with more businesses remaining open for curbside pick-up. Anecdotally, based on discussions during the trip booking process, more riders are accessing the service for essential trips (i.e. groceries, medication, etc.) in 2021, where in 2020 they avoided going out and rather relied on other options to obtain necessities. Ridership over the past three months has exceeded that of the same months in 2020 notwithstanding the lockdown provisions that were still in place in 2021.
The ridership levels and trends set out in this report were considered when preparing the estimates that are included in the 2022 Operating budget (see Staff Report #4, dated August 25, 2021). As discussed in that report, the extent to which the Safe Restart funding will be available for 2022 is not known at this time, and the amount that would potentially be available will not be known until the end of 2021.
Recommended by:
Katie Burns, Director of Planning
Shawn Wilson, Director of Operations
Mike Gregor, Director of Finance
Concurred in by:
Kelly S. Paleczny, General Manager