Staff Report #8
March 30, 2022
To All Commissioners
Re: COVID-19 Ridership and Service Impacts
Recommendation
The report be NOTED and FILED.
Background
As set out in the Commission’s 2020 Annual Report, the pandemic declaration in March of 2020 and associated lockdown measures that followed resulted in a significant decline in transit ridership on both the conventional and specialized services. Each new wave of the pandemic has resulted in varying levels of public health measures, including lockdowns in some cases.
Effective with this report and going forward, this update report now covers all COVID-related impacts including both ridership and service and will continue to be provided on a regular basis while COVID impacts continue to be experienced.
Conventional Transit
Ridership
The organizational philosophy adopted at the onset of the pandemic with respect to service levels was to ensure that all areas of the city that were served by transit would continue to be served, albeit at lesser frequencies based on employee resource availability.
The graph below provides an overview of the ridership levels on the conventional service for 2021 and 2022 to date with comparative data for 2020, both as a percentage of what would normally be expected in each month noting the numbers are based on actual boardings as counted by the automatic passenger counters on buses. The bars are coloured to match the various stages of lockdown as noted below:
Green Prevent – no, very limited restrictions in place
Yellow Protect & Stage 3 under the current re-opening plan – very limited restrictions in place
Orange Restrict & Stage 2 under the current re-opening plan – limited restrictions in place
Red Control & Stage 1 under the current re-opening plan – numerous restrictions in place
Grey Lockdown – full lockdown restrictions in place
The colour blue in the graphic is used for January and February 2020 given the pandemic declaration had not occurred at that point in time. Bars that are striped indicate a change during the month from the base colour to the striped colour.
2020, 2021 and 2022 Conventional Transit Weekday Ridership as a Percentage of Normal
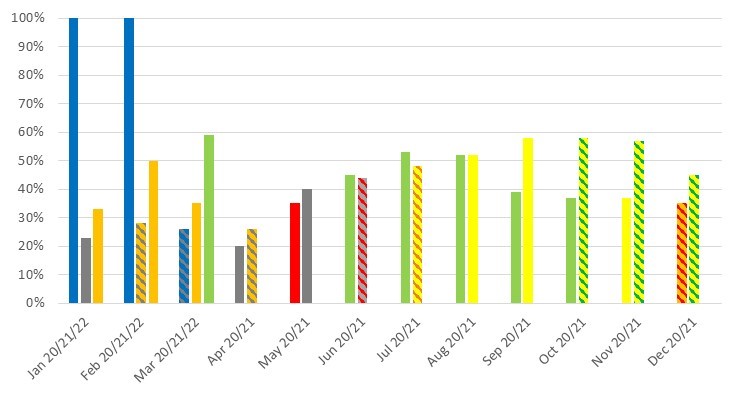
The conventional transit service has been operating at approximately 90% of normal service hours for each service period since September 2020. The above graph clearly depicts the impacts that the various stages of lockdown have on conventional transit service ridership. As indicated in the graph, weekday ridership for in March 2022 to date has rebounded to approximately 60% of normal, which was anticipated given the return of more students to campus. Of interest, weekend ridership in March rose to between 70% and 80% of normal levels. With the elimination of virtually all Provincial restrictions on March 1, 2022, it is anticipated that ridership will continue to rebound over the coming months.
Operator Resource Requirements
Work continues with respect to the onboarding of Operators in an effort to reach the required complement level to return to full service levels and implement the 2021 service improvements. In order to implement the full slate of 2021 improvements, an Operator complement of 436 is required. A class of six Operators completed their training at the end of February, and another class of six began training in early March. The April class of six has been filled, which, once completed, will bring the complement level to where it needs to be in order to return to 100% service levels for the spring signup period (beginning May 1), and to begin the implementation of the 2021 service improvements. Recruitment will continue throughout the summer in order to meet the complement requirements to implement the 2022 service improvements in September 2022.
Supply Chain Issues
Over the past number of months, supply chain issues have, to varying extents, impacted the ability to service and maintain the conventional fleet.
At time of report writing, there were 15 buses that are not available for service as the parts required are outstanding, noting in some cases, suppliers are indicating a delivery date of 16 weeks out from date of order. As indicated with the decrease in number of buses down from last month (from 34 to 15), significant progress has been made on the previously reported supply chain issues as administration has focused on procuring parts from alternative vendors.
However, a new issue has transpired since the last update with respect to the availability of transmission fluid for buses noting there is currently no availability for this product anywhere in North America. Administration is working on identifying sources for the product noting the current on-site supply will last two to three months.
Bus availability will continue to be closely monitored in the coming months noting the intent to move to 100% service levels and begin the implementations of 2021 service improvements beginning in May will increase the number of buses required daily for service.
Specialized Transit
Ridership
The graph below provides an overview of the ridership levels on the specialized service for 2021 and 2022 to date, with comparative data for 2020 as a percentage of what would normally be expected in each month. Consistent with the earlier graph, the colours in the various bars are reflective of the stages of lockdown that were in place at the time.
2020, 2021 and 2022 Specialized Transit Ridership as a Percent of Normal
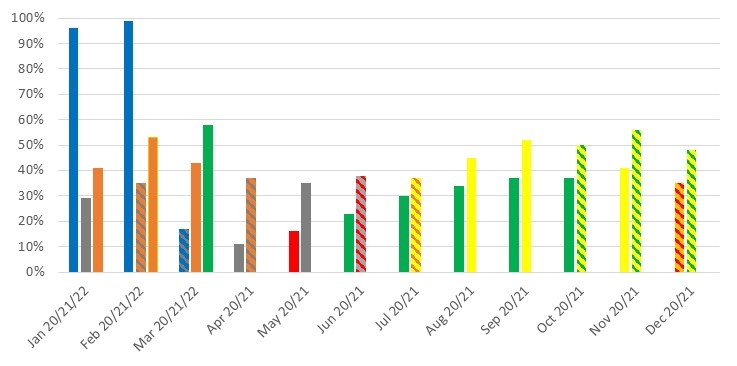
As the graph indicates, ridership levels to date for March 2022 surpassed the previous pandemic-period high from November 2021. Administration will continue to monitor trip demand by time of day and day of week, and gradually increase service hours to meet demand.
Service
As indicated above, Administration is continuing to monitor service demand and will work with the contracted service provider to increase service levels as demand warrants. The only issue with respect to making these adjustments relates to the service provider’s ability to secure drivers to meet the increased service requirements.
Recommended by:
Katie Burns, Director of Planning
Mike Gregor, Director of Finance
Craig Morneau, Director of Fleet & Facilities
Concurred in by:
Kelly S. Paleczny, General Manager