Staff Report #3
May 8, 2017
To All Members of the Accessible Public Transit Service Advisory Committee
Specialized Service Performance Statistics – March 31, 2017
Recommendation
That the Accessible Public Transit Service Advisory Committee FORWARD the report to the Commission for their review and consideration.
Background
Performance statistics for the Specialized Service for the three months ending March 31, 2017, are set out in Enclosure I, with 2016 statistics and 2017 performance targets provided for comparative purposes.
In summary:
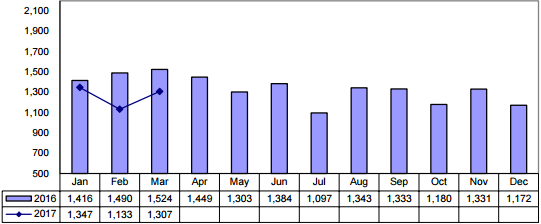
- Eligible passenger trips provided in the first three months of 2017 were 4,418 (6.8%) higher than 2016; however slightly worse than budget.
- The number of attendant/companion trips provided in the first three months of 2017 decreased by 54 (-0.7%) as compared to those provided in 2016; however were slightly less than budget.
- Service productivity for the first three months of 2017 averaged 2.1 rides per hour, which is consistent with that for the same period in 2016.
- Rides over one hour in the first three months of 2017 averaged 2.1% which is consistent with that experienced for the same period in 2016.
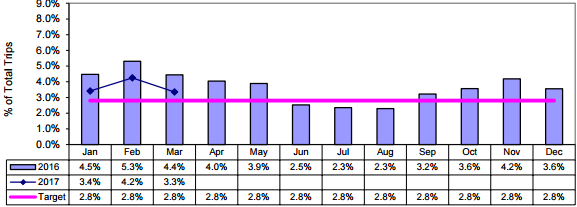
- Pick-ups over 30 minutes for the first three months in 2017 averaged 0.4% of total trips, which is slightly better than the 0.6% for the same period in 2016.
- The cancellation rate for the first three months in 2017 averaged 16.2%, which is slightly better than the 16.5% over the same period in 2016. There were 3,286 late cancellations in the first three months of 2017, representing 24.1% of total cancellations.
- The no-show rate for the first three months of 2017 averaged 1.7%, consistent with that for the same period in 2016.
- The non-accommodated trip rate for the first three months of 2017 averaged 3.7% (total of 3,189 trips), better than the 4.7% (3,942 trips) for the same period in 2016.
- The average number of same day bookings for the first three months of 2017 was 1,335 trips, down slightly from the average of 1,461 provided over the same period in 2016.
- New registrations continue to occur at a rate of approximately 75 per month, with the total registrants at the end of March reaching 8,115. This represents an increase of 12.2% over 2016.
Enclosure
I – Specialized Transit Service Performance – March 31, 2017
Recommended by:
Christopher Murphy
Supervisor, LCTB
Concurred in by:
Kelly S. Paleczny
General Manager
Specialized Transit Service Performance For the 3 months ending March 31, 2017 with comparative figures for 2016
Eligible Passenger Trips
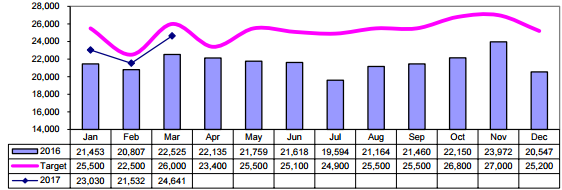
| Eligible Passenger Trips – March | 24,641 |
| Eligible Passenger Trips – YTD | 69,203 |
Attendant/Companion Trips
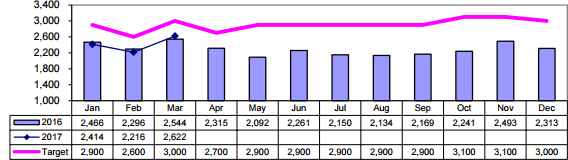
| Attendant/Companion Trips – March | 2,622 |
| Attendant/Companion Trips – YTD | 7,252 |
Service Productivity – Trips per Service Hour – Primary Service Provider Only
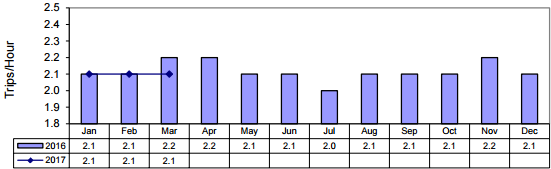
| Primary Service Productivity – March | 2.1 |
Specialized Transit Service Performance For the 3 months ending March 31, 2017 with comparative figures for 2016
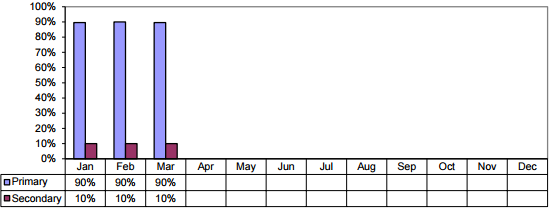
Service Allocation – Primary and Secondary
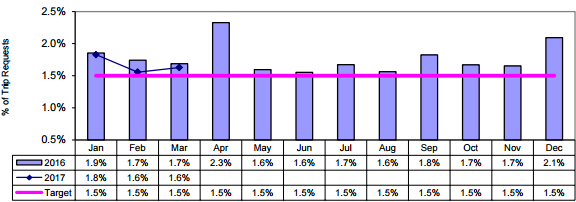
Service Quality – Rides Over 1 Hour – expressed as % of eligible passenger trips
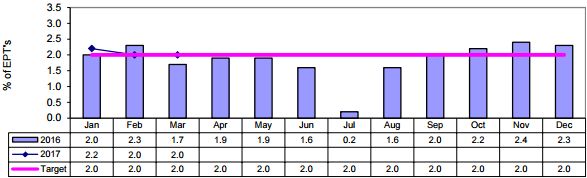
| Total Rides Over 1 Hour – March | 447 |
| Total Rides Over 1 Hour – YTD | 1,287 |
Service Quality – Pick up over 30 Minutes – expressed as % of eligible passenger trips
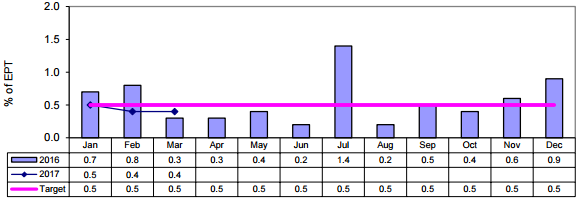
| Total Pick Ups Over 30 Minutes – March | 92 |
| Total Pick Ups Over 30 Minutes – YTD | 266 |
Specialized Transit Service Performance For the 3 months ending March 31, 2017 with comparative figures for 2016
Cancellations – expressed as % of total bookings
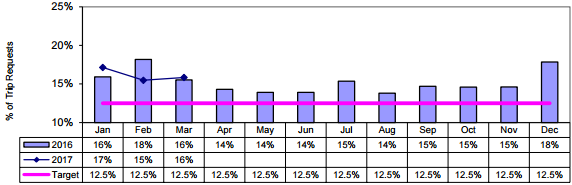
| Total Late Cancellations | 1,134 |
| Late Cancellations as a % of Total Bookings | 3.6% |
No Shows – expressed as % of total bookings
| Total No Shows – March | 486 |
| Total No Shows – YTD | 1,410 |
Non Accommodated – expressed as % of total bookings
| Total Non Accommodated – March | 1,034 |
| Total Non Accommodated – YTD | 3,189 |
Specialized Transit Service Performance For the 3 months ending March 31, 2017 with comparative figures for 2016
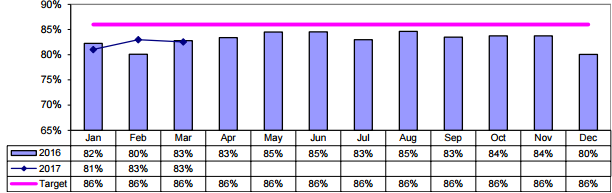
Total Trips Completed (Booked vs Taken)
Same Day Bookings Provided