Staff Report #1
November 25, 2020
To All Commissioners
Re: Electric Bus Assessment
Recommendation
That the Commission:
- RECEIVE the London Transit Commission Fleet Electrification Analysis Report prepared by the Canadian Urban Transit Research and Innovation Consortium (CUTRIC);
- DIRECT administration to provide a summary of report findings to Civic Works; and
- DIRECT administration to issue a request for proposal for the completion of a detailed Electric Bus Implementation Plan which will include a recommended path forward as well as projected costs associated with full fleet conversion.
Background
At the January 29, 2020 meeting, the Commission approved a contract award to the Canadian Urban Transit Research and Innovation Consortium (CUTRIC) for the completion of a Fleet Electrification Analysis Study. The study has been completed and is set out in Enclosure I (for Commissioners only).
As indicated in the January 29, 2020 report, planning for the eventual transition of a transit fleet to zero-emission buses is a complicated process, with many key factors requiring careful assessment and consideration in order to ensure all stakeholders have a clear understanding of the potential benefits and drawbacks, including the associated costs of a project of this scope and magnitude.
Given the desire of transit systems across the country to play their part in greening public transit services, most have initiated this discussion, with many being at various stages of the process. The Canadian Urban Transit Research and Innovation Consortium (CUTRIC) launched phase I of the Pan-Canadian Electric Bus Demonstration and Integration Trial (Trial) in 2019. The Trial is deploying electric buses and overhead chargers, standardized to the OppCharge Protocol, across three municipal jurisdictions in Canada. The deployment is preceded by predictive modelling using CUTRIC’s Rout∑.iTM modelling tool and will be followed by data collection and analytics from the data loggers on-board the vehicles and chargers.
The multi-stakeholder project is being governed by a Project Steering Committee through a consultative process and has, collectively, been able to generate important guidance documents to assist public fleets including transit agencies and utility/local distribution companies to overcome the barriers of uncertainty and high risk associated with the adoption of electrified propulsion technologies. Eighteen standardized electric buses and seven standardized overhead chargers will be deployed across Vancouver, Brampton and York Region as part of this trial. Four Universities are also involved in carrying out research and development (R&D) activities across various aspects of electromobility-ranging from electric powertrain, cybersecurity, energy storage and data visualization. In addition, the Toronto Transit Commission is also undertaking a pilot project with electric buses, with the four current North-American electric bus providers all participating. Data collected from each of these pilot programs will be extremely beneficial to systems like London Transit that are considering pilot projects of their own.
The evaluation process that needs to be undertaken prior to the launch of a pilot project, or a transition to zero-emission buses in a fleet includes a number of key and critical analysis and assessments. The completion of the London Transit Commission Fleet Electrification Analysis completes the first step in this process, noting it touches on a number of the assessments. The table below outlines these factors, and includes an indication of the status of each currently.
| Assessment | Status |
| Operational Assessment | Underway |
| Market Analysis | Outstanding |
| Energy Requirements | Underway |
| Charging Requirements/Options | Underway |
| Facility Needs | Outstanding |
| Utility Interconnection | Outstanding |
| On-Site Power | Outstanding |
| Internal/External Expertise Requirements | Outstanding |
| Financial Analysis | Outstanding |
| Procurement Strategy | Outstanding |
| Implementation Phasing | Outstanding |
The completion of the Fleet Electrification Analysis Report represents the first step in the process of the creation and implementation of a Zero Emissions Fleet Conversion Plan, noting that prior to making any decisions with respect to moving forward with the procurement of the required technology, the organization requires a solid understanding of not only what is possible based on currently available technology, but also the financial requirements over the full implementation horizon. When reviewing the report, it is important to understand that the analysis was undertaken fleet wide, and as such, included a number of assumptions that were applied to like-routes. Further, in order to assess the implications for each route based on bus options available, each was assessed for a 40’ battery electric bus (BEB) and a 60’ battery electric bus, with both depot and opportunity charging options. In addition, each route was assessed based on a 40’ Hydrogen Fuel-cell bus (FCEB) in order to identify alternatives for routes that, in their current form, may not be compatible with a move to electrification given current technology available.
The Rout∑.iTM simulation tool utilized for the CUTRIC analysis is comprised of three main parts, Geographic information system (GIS) modelling, duty cycle modelling, and energy consumption modelling, together providing insight into the opportunities and risks associated with full system conversion to BEBs. Administration provided many data sets to CUTRIC in order to allow them to complete the analysis, including current schedules, traffic impediments and speed limits and topography of the city. The compilation of this data provides a picture of the operating environment specific to London Transit.
Given the variations in ridership levels by route, time of day, and day of week, the modelling considered three different duty cycles (light, medium and heavy). The light duty cycle would be considered a best case scenario from a BEB perspective, with the bus stopping at only half of the stops and traffic lights on the route, and only the driver being on board. The medium duty cycle uses the same assumptions with respect to stopping as the light cycle, however it assumes an average passenger load based on LTC data. Finally, the heavy cycle, the bus is assumed to stop at all stops and operates at a rush-hour passenger load. Given the revenue recovery model that is utilized as part of the annual service plan review process to assess route performance and make adjustments to routes that are not meeting minimum thresholds, LTC routes are considered to be operating in the medium to high duty cycles at virtually all operating times.
Predicted Success Rates of Bus Types Assessed
As indicated earlier, the analysis looked in part to predict the success rates for the three types of buses assessed (40’ BEB, 60’ BEB, and 40’ FCEB). The analysis also considered the various charging scenarios that could be implemented (depot-only, opportunity charging (on-road) and Fuel Cell). The graph below sets out the success rates associated with depot-only charging during the weekday service levels. While these analysis were undertaken for Saturday and Sunday levels of service as well, the weekday analysis is the one that needs to be considered given this service level includes the most demand for fleet. Lower success rates for Saturday and Sunday levels of service can be overcome with swapping out buses during the service day given that fewer buses are required during these operating days.
Weekday Service Success Rates of 40” and 60” Battery Electric Buses with Depot-Only Charging
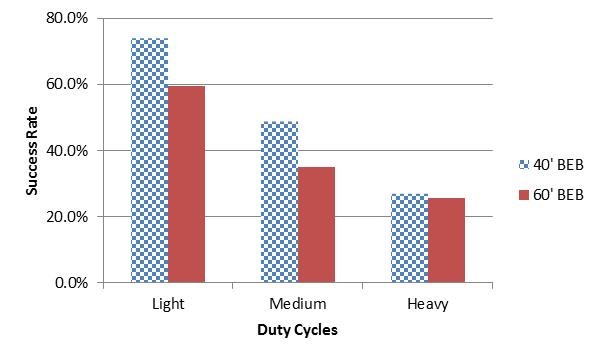
As the chart indicates, during periods of heavy-duty cycles, the success rate of a one-to-one replacement of a diesel bus with the BEB and depot-only charging is approximately 26% for both sizes of bus when operating on a heavy-duty cycle. The success rate during the medium duty cycle increases to a range of 35% to 48% dependent upon bus type. This analysis essentially indicates that in order to transition to a depot-only charging solution with BEBs, the current diesel fleet would need to be increased by approximately 50% in order to have enough buses to deliver the current levels of service. Given the requirement to purchase an additional 100 buses, coupled with the associated requirement of a third facility to accommodate the increased fleet, this approach is not deemed financially viable.
The next scenario that was modelled for the same buses was depot charging with opportunity charging (on-route) based on the assumption that every bus would have the ability to receive a maximum five minute charge from an opportunity charger at the end of each round trip.
Weekday Service Success Rates of 40” and 60” Battery Electric Buses with Depot and Opportunity Charging
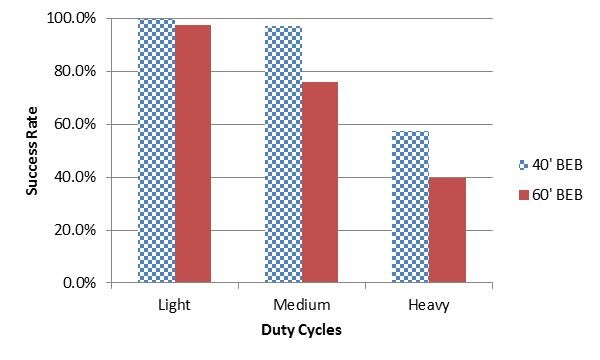
As indicated in the chart, the success rates significantly improve with the introduction of opportunity charging for all routes; however, given the costs and required land implications with the installation of opportunity chargers covering every route in the system, this approach is not considered financially viable for the entire fleet. What this analysis does demonstrate is, that there are some routes that would benefit from opportunity charging, while others could operate on a one-to-one replacement ratio with depot-only charging.
The final analysis undertaken considered the success rates of FCEBs, with the assumption that all buses were fully filled prior to start of day. The graph below sets out the success rates of a one-to-one replacement of diesel buses with a 40’ FCEB (60’ FCEB not currently available).
Weekday Service Success Rates of 40” Hydrogen Fuel Cell Electric Bus
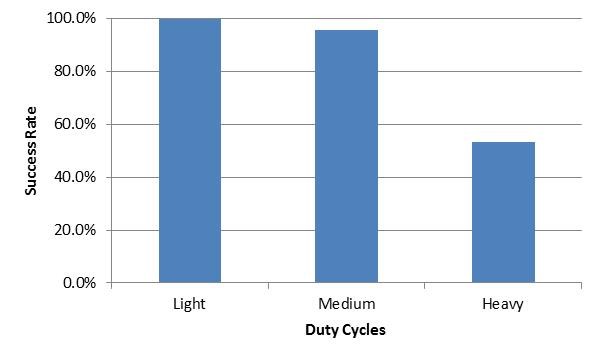
As indicated in the chart, the success rates for the FCEB reach almost 54% for the weekday service level, which represents the highest success level of the three buses assessed. As discussed later in the report, the costs associated with both the capital bus purchases as well as the operational costs associated with hydrogen fuel are significant. Again, as with the depot/opportunity charging scenario discussed above, the introduction of FECB’s into the plan for fleet electrification may need to be considered depending on the available technology and planned date for full conversion of the LTC fleet.
Greenhouse Gas (GHG) Emission analysis
One of the primary reasons for considering the transition to a BEB fleet is the reduction in GHG footprint of the transit service. The following table provides an overview of the estimated annual GHG emissions for each type of bus assessed as compared to diesel buses.
| 40’ Diesel | 60’ Diesel | 40’ BEB | 60’ BEB | 40’ FCEB | |
| Annual GHG Emissions (Tonnes) | 29,790 | 43,690 | 490 | 750 | 1,310 |
| % Reduction from Comparable Diesel | 5,980% | 5,725% | 2,174% |
As the table indicates, there is significant reductions in GHG emissions associated with the move to BEB or FCEB technologies, notwithstanding the significant strides the diesel engine has made over the last number of years in efforts to become a greener technology.
Energy and Fuel Cost Estimations
The financial analysis associated with the move to a BEB fleet needs to include both the capital costs associated with the purchase of the buses and charging infrastructure, as well as the operating costs associated with running the fleet. The following table provides an estimate of the annual fuel costs associated with each type of bus assessed as compared to the 40’ and 60’ diesel buses, assuming the entire LTC fleet is made up of each type of bus assessed.
Annual Energy/Fuel Cost Estimates – Full Fleet
| Bus Fleet and Charging Type | Annual Fuel/Energy Costs | Annual Savings Compared to Diesel |
| 40’ Diesel Bus Fleet | $ 7,144,800 | |
| 60’ Diesel Bus Fleet | $ 10,478,000 | |
| 40’ Battery Electric with Depot Charging | $ 7,417,200 | $ (272,400) |
| 60’ Battery Electric with Depot Charging | $ 9,325,200 | $ 1,152,800 |
| 40’ Battery Electric with smart Depot Charging | $ 5,257,200 | $ 1,887,600 |
| 60’ Battery Electric with smart Depot Charging | $ 7,873,200 | $ 2,604,800 |
| 40’ Battery Electric with Depot & Opportunity Charging | $ 7,417,200 | $ (272,400) |
| 60’ Battery Electric with Depot & Opportunity Charging | $ 9,325,200 | $ 1,152,800 |
| 40’ Battery Electric with smart Depot & Opportunity Charging | $ 4,561,200 | $ 2,538,600 |
| 60’ Battery Electric with smart Depot & Opportunity Charging | $ 7,104,000 | $ 3,374,000 |
| 40’ Hydrogen Fuel Cell Bus Fleet (Electrolysis Process) | $ 10,998,000 | $ (3,853,200) |
| 40’ Hydrogen Fuel Cell Bus Fleet (SMR Process) | $ 2,680,800 | $ 7,797,200 |
While almost every option assessed results in an annual fuel cost savings as compared to the current diesel fleet, it is important to recognize this is based on an entire fleet, and as such, it would take a significant period of time to accumulate savings of this magnitude given the replacement cycles of buses.
Financial Implications
Given the incremental costs associated with the bus and related infrastructure costs for either the BEB or the FCEB, the payback may not be experienced within the useful life of the bus. However, it should also be recognized that these analysis do not include the anticipated savings associated with other operating costs, so there is still the possibility of a payback over the life of a bus. This payback, if achieved does not consider the costs associated with the charging infrastructure required for any of the options assessed.
Assuming a one-to-one replacement of a diesel bus with a BEB, the incremental cost of the BEB is in the range of $600,000. In addition, the charging infrastructure costs, current estimates of which are set out below, need to be considered.
- In-Depot Chargers (100-150 kWh power):
- 2:1 (bus:charger) ratio, approximately 5hrs to take a full charge
- Approximately $130,000 per unit excluding taxes
- Opportunity Chargers (450-600 kWh power):
- 10:1 (bus:charger) on-street and up to 30:1 for in-depot charging (allowing +/- 10mins/bus). Charge time will run between 4-7mins (450kWh chargers) and 2-5mins (600kWh chargers) subject to state-of-charge when the bus begins charging
- Approximately $1.5 million per unit excluding taxes
With the FCEB option, assuming a one-to-one replacement, the incremental cost of the bus over that of a comparable diesel bus can reach $1 million. The lack of local hydrogen supply chain causes the costs to be higher than diesel, and while the installation of electrolyzers and high-pressure tanks on site can avoid supply chain issues, the costs of these installations could reach the tens of millions for each facility.
Next Steps
As the report recommendation sets out, the next step in this process would be the completion of a detailed Electric Bus Implementation Plan. The request for proposal will be issued subsequent to Commission approval, and will be awarded early in 2021. Completion of the Implementation Plan will be dependent upon the timing provided by the successful bidder.
As the earlier sections in this report illustrate, the transition to BEBs or FCEBs is a complicated and expensive process that needs to be carefully planned and communicated in order to ensure all stakeholders are onside with the required investments and path forward. This section provides commentary on the various outstanding assessments or analysis that need to be undertaken as part of the final Implementation Plan.
Operational Assessment
With respect to the battery electric bus (BEB) option, a number of challenges are highlighted in the report which need to be addressed as part of an implementation plan. One of the primary challenges is the time required to fully charge a depleted battery, noting the low-powered in-depot charging process can take between three and five hours to complete. Given the manner in which transit fleets are utilized, reliance on depot-charging only is not considered feasible, given it would result in the need to increase the BEB fleet size by approximately 50% in order to ensure availability of buses for service. Some of these challenges can be overcome, but require careful planning and consideration for the following:
- Optimization of the number and location of chargers to reduce capital costs;
- Optimization of charging schedules to avoid high-demand charges during high-time-of-use rate periods;
- Management of bus schedule adjustments to compensate for the charging requirements of BEBs;
- Increasing the importance of deadhead mileage in order to maximize BEB in-service performance;
- Considering passenger loads and local traffic when undertaking route planning; and
- Assessing the use of air conditioning and heating systems given their potential impact on BEB performance
Careful analysis of the above is expected to highlight potential areas of concern that may be resolved through a pilot program as the first step of the full implementation. This pilot would provide important insight into actual performance versus that predicted through modelling.
Market Analysis
Once a draft Implementation Plan is prepared, an assessment of the vehicles and charging infrastructure available in the North American market would be undertaken. This information will be important in the planning process given capital costs are expected to decline going forward, and technology is rapidly changing, resulting in faster charging rates and increased performance of buses.
Energy Requirements
As indicated earlier in the report, a depot-only charging scenario is not practical, nor feasible given the requirement for a significant increase in bus fleet size that would be required in order to continue to provide the same level of service. The Implementation Plan will include consideration of both depot and opportunity charging, and where these options fit into the overall implementation plan. London Hydro would need to be consulted as part of this assessment to ensure appropriate infrastructure is in place in the locations that would require power for the chargers.
Charging Requirements/Options
Given the finding that depot-only charging scenario is not feasible, coupled with the significant costs of the opportunity charging option, careful assessment of potential locations for opportunity charging that would serve the maximum number of routes would be undertaken. Additionally, London Hydro would need to be consulted in order to identify locations that have the required infrastructure to supply the electricity required for the chargers.
Utility Interconnection and On-Site Power
As indicated in the previous two sections, discussion with London Hydro will be required in order to determine the availability of on-site power and any upgrade requirements that may be required as the size of the BEB fleet grows and the charging requirements increase.
Facility Needs
The Implementation Plan must also consider the facility needs associated with the transition to a BEB fleet. In London’s case, an additional complication that must be considered is the planned demolition and rebuilding of the Highbury Facility. The Implementation Plan will need to be phased in a manner that ensures no significant infrastructure retrofits will be undertaken at this facility, but rather initially focussed on the Wonderland Facility. Additionally, the assessment will include any requirements relating to utility upgrades at the facility that need to be undertaken. Important in this assessment is the fact that conversion to a fully electric fleet will take place over time, and as such, any required expansion may be phased to coincide with the implementation plan.
Internal and External Resource Requirements
The rate of adoption of electric buses across the Province and the Country will play a role in each system’s ability to hire new and/or train existing employees as well as secure external expertise, all while continuing to maintain the existing diesel fleet. Costs associated with these requirements will need to be included as part of the financial analysis of the Bus Fleet Implementation Plan.
External Resources
Internal Resources
A project of this magnitude will require an internal resource(s) dedicated to the overall project management and oversight of the pilot project as well as the eventual larger transition. Additionally, the requirements for employees that are trained and qualified to maintain and repair two types of bus may result in increased staffing requirements for the foreseeable future. These resources will need to be planned for and included in budgets to coincide with the Electric Bus Implementation Plan in order to ensure the smooth transition.
Financial Analysis
The final step in the overall Implementation Plan will be to summarize all of the information gathered in previous steps, and conduct a thorough financial analysis, including multi-year capital and operating budget impacts, business case, and appropriate funding model. While the environmental benefits of moving to a greener fleet may be the impetus for the move, the costs associated need to be well defined and understood by all stakeholders. Additionally, appropriate funding needs to be established to ensure the project can continue through completion. The introduction of a pilot program with a small number of buses which is not carried through with a fleet conversion results in an “orphan fleet” of buses that will require trained employees to maintain and repair through their useful life (generally 12 years) at which time the charging infrastructure will no longer be required and costs associated with same will be sunk.
Key inputs into the financial analysis will be the rate at which the transition to electric vehicles will take place as well as the selected charging option(s) and supporting infrastructure that will be required. While the Federal Government has indicated an interest in funding green technologies as a priority, it is expected that any funding approvals for transit projects relating to the adoption of these technologies will be subject to a feasibility study being completed. The system assessment recommended in this report is the first step that would be required in order to complete the feasibility study.
Enclosure
I – London Transit Commission Fleet Electrification Analysis (Commissioners Only)
Recommended by:
Craig Morneau, Director of Fleet & Facilities
Mike Gregor, Director of Finance
Katie Burns, Director of Planning
Shawn Wilson, Director of Operations
Concurred in by:
Kelly S. Paleczny, General Manager