Staff Report #10
March 27, 2019
To All Commissioners
Re: Voice of the Customer – 2018 Survey
Recommendation
That the report be NOTED and FILED.
Background
One of the guiding principles set out in the 2015-2018 Business Plan is to be customer-focused – striving every day to improve the customer experience. A fundamental step in moving toward being more customer-focused is to ensure that every decision made is viewed not only from a business perspective, but also from the customer’s perspective.
In 2016 two survey waves were completed, one in July and one in November/December. After reviewing the two waves of data, it was determined that the best time to conduct the annual surveys going forward would be in November of each year, noting the ridership make-up and service conditions during this period would be the most reflective of service realities. The November time period also provides the opportunity to assess customer satisfaction post-September service changes. The 2018 survey was scheduled to occur in November, however a scheduling conflict with the contractor resulted in the survey being conducted the week of January 14, 2019. In addition, the 2018 survey marked the first year for the Voice of Customer survey to be conducted for Specialized Transit customers. Commentary in the remainder of the report has been split between Conventional and Specialized surveys.
Conventional Transit Survey
For each survey wave, slightly over 500 surveys were undertaken with transit customers on board LTC buses, covering all routes in the system. The surveys were conducted during all service periods throughout the day on weekdays, Saturdays and Sundays and in quantities proportional to each route’s ridership by day of week and time period.
Customer Characteristics
The demographic data gathered through the surveys indicates the following with respect to LTC customers:
- approximately 93% of LTC customers utilize the service at least three days per week
- the majority (63%) of LTC customers are between the ages of 18 and 29
- the gender split between riders is 51% female and 47% male
- to/from work and educational institutions are the two primary reasons for travel amongst LTC riders, accounting for 85% of riders combined
New Questions
A number of new questions were added to the 2018 survey in order to provide the opportunity for peer comparisons with other Ontario transit systems who utilize this mechanism to gain customer feedback. The following tables provide an overview of the responses received from new questions that are not commented on in more detail in this report or in Staff Report #11 – 2019 Annual Service Performance Report – Conventional Transit Service, dated March 27, 2019.
Voice of the Customer – Community Value for Investment Perceptions
| Statement | 2018 |
| LTC provides value to the community based on funding it received | 66% |
| LTC should receive increased funding to improve services | 68% |
Voice of the Customer – Level of Service Perceptions
| Statement | 2018 |
| Level of service in the past year has: | |
| Gotten worse | 11% |
| Stayed the same | 65% |
| Gotten better | 24% |
This group of questions is intended to gauge the customer’s perception of the value LTC provides to the community, and whether the levels of service have improved over the past year. Given this survey was undertaken after the fourth year of the five year plan’s service improvements, when an additional 18,000 service hours had just been added resulting in significant service improvements, the responses to both sets of questions is disappointing. It is important to remember when reviewing these results, that they are perceptions based on personal experience. Every change made to a transit route, possibly with the exception of a frequency improvement, has the potential to negatively impact customers, and as such, while it may be viewed as an improvement system wide, may still be viewed by the customer as having gotten worse. Notwithstanding this fact, as set out in Staff Report #8 – 2019-2022 Business Plan, dated March 27, 2019, a key strategy over the next four years under the objective of being open and transparent is to increase the promotion of LTC, highlighting the benefits to current riders as well as those to the community at large.
Customer Safety and Security
The two survey waves conducted in 2016 included questions with respect to the riders feeling of safety, both while waiting for the bus and while riding the bus, the results of which are set out below.
2016 Customer Satisfaction Levels – Safety While Waiting for the Bus
| Satisfaction Level | Waiting for Bus Average % | Riding the Bus Average % |
| Extremely Dissatisfied | 1% | 1% |
| Dissatisfied | 3% | 2% |
| Neutral | 14% | 9% |
| Satisfied | 35% | 30% |
| Extremely Satisfied | 47% | 58% |
As indicated in the tables above, 82% of respondents in the first two waves indicated they felt safe while waiting for the bus, and 88% of respondents indicated they felt safe riding the bus. Of note, the remaining respondents for both questions fell primarily in the neutral category.
Given the ambiguity of the aforementioned questions, it was determined that additional questions would be posed going forward relating to feelings of safety both while waiting and while riding the bus. The following tables set out the results of the new additional questions for 2017 and 2018.
Waiting for the Bus
Customer Satisfaction Levels – Safety While Waiting for the Bus
| Question | 2017 Yes |
2018 Yes |
| Feel safe from unwanted conversation/contact while waiting for the bus? | 75% | 79% |
| Experienced unwanted conversation/contact while waiting for the bus? | 38% | 40% |
| Witnessed unwanted conversation/contact while waiting for the bus? | 43% | 44% |
As the table indicates, the overall 79% feeling safe while waiting for the bus is down from the 82% when the question was asked generically in the 2016 surveys. The breakdown between male (84%) and female (74%) illustrates that generally females feel less safe from unwanted conversation/contact while waiting for the bus.
The response rates from the last two questions are somewhat contradictory to the first, in that 40% have experienced unwanted conversation/contact, and 44% have witnessed it. The following table breaks down the second and third questions by gender.
Customer Satisfaction Levels – Safety While Waiting for the Bus
| Female | Male | |
| Experienced unwanted contact/conversation waiting | 44% | 36% |
| Have witnessed unwanted conversation waiting | 45% | 43% |
The increase in feelings of safety while waiting for the bus in the 2018 survey could be the result of the inclusion of solar powered lighting in all LTC shelters. A pilot program is also being undertaken in 2019 with the installation of four solar powered lights at key LTC stop locations that have been identified as being poorly lit. The lights have been installed at the identified stops and feedback will be monitored in the coming months. Should the pilot be a success, expansion of this program will be included in future budgets.
Riding the Bus
Customer Satisfaction Levels – Safety While Riding the Bus
| Question | 2017 Yes |
2018 Yes |
| Feel safe from unwanted conversation/contact while riding the bus? | 88% | 86% |
| Experienced unwanted conversation/contact while riding the bus? | 40% | 41% |
| Witnessed unwanted conversation/contact while riding the bus? | 51% | 52% |
As the table indicates, the overall 87% average feeling safe while waiting for the bus is consistent with the response when the question was asked generically in the 2016 surveys. The breakdown between male and female illustrates that generally females (84%) feel less safe from unwanted conversation/contact while riding the bus than males (88%).
The response rates from the last two questions are once again somewhat contradictory to the first, in that 41% have experienced unwanted conversation/contact, and 52% have witnessed it. The following table breaks down the second and third questions by gender.
Customer Satisfaction Levels – Safety While Riding the Bus
| Female | Male | |
| Experienced unwanted contact/conversation on bus | 47% | 34% |
| Have witnessed unwanted conversation on bus | 54% | 50% |
Further analysis of the experience ratings for both riding the bus and waiting for bus show that approximately 77% of females who indicated they had experienced unwanted contact/conversation fell in the age group of 18 to 29.
In 2018, the Travel Safe program was launched in an effort to remind customers of the various options available to them while riding the bus (i.e. audio/video recordings, requesting Operator for assistance). Also in 2018, administration participated in the Safe Cities Workgroup, which included the ability to review commentary posted on the Safe Cities website with respect to events in which respondents felt unsafe. A number of the comments included reference to customers experiencing unwanted contact/conversation on a bus and leaving the bus in an effort to get away from the situation rather than advising the bus Operator and seeking assistance. Given the age demographic that rates highest with respect to negative experience, LTC administration has committed to working with both Western and Fanshawe College to ensure information with respect to the Travel Safe program is included in student orientation packages.
Net Promoter Score
Another aspect the Voice of the Customer process reveals is the organization’s Net Promoter Score (NPS) by ascertaining from the respondents based on all things considered, how likely they would be to recommend riding an LTC bus to a friend or neighbour. This metric is intended to assess loyalty and word of mouth favourability among actual customers. The interesting aspect of this measure is that it can be utilized to compare performance between organizations across different business sectors, noting the actual business offering is irrelevant in this measure, but rather the focus is on the level of satisfaction the customer feels they receive.
Survey respondents were asked to rate how likely they would be to recommend LTC on a scale of 0-10, with 0 being very unlikely and 10 being very likely. The NPS is arrived at by subtracting the percentage of detractors (those rating from 0-6) from the percentage of promoters (those ranking from 9-10). Also included in this measure is the group considered passives (those rating from 7-8).
The chart below sets out the comparison of results from each of the surveys of London Transit customers conducted over the past three years.
Net Promoter Score – Likelihood of Recommending LTC
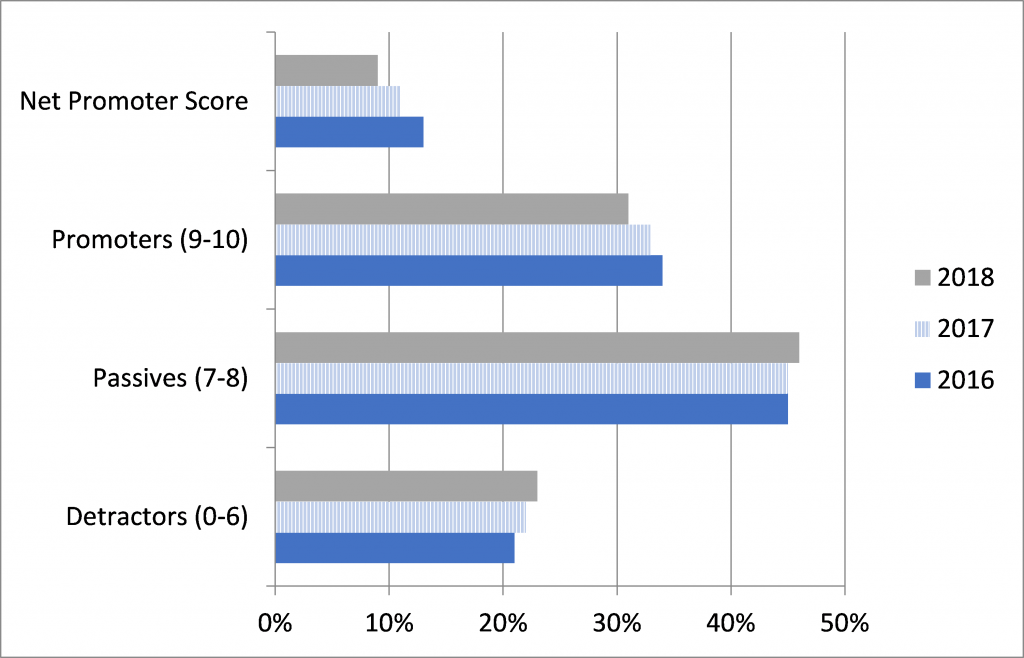
As the chart indicates, the NPS has shifted by two, down to 9%, caused by a minimal shift in both the Promoter and Detractor categories. The positive aspect of these results is that the passives are considered the most likely to be influenced to become promoters as the service metrics they identify as most important are improved.
The score groupings used to determine each category and the ultimate NPS are set so this measurement can be used to compare organizations across all sectors with respect to their customer’s loyalty. However, a closer look at the breakdown of scores provides insight into the levels of satisfaction and dissatisfaction within each of the categories. The table below provides the number of responses to each of the rankings from 0 through 10.
| Ranking | Number | Percent |
| 0 | 4 | 1% |
| 1 | 1 | 0% |
| 2 | 4 | 1% |
| 3 | 12 | 2% |
| 4 | 13 | 2% |
| 5 | 42 | 8% |
| 6 | 43 | 8% |
| 7 | 111 | 21% |
| 8 | 128 | 25% |
| 9 | 56 | 11% |
| 10 | 108 | 21% |
| Total | 522 | 100% |
Using a score of 5 as the halfway mark, 14% of customers ranked LTC below a passing grade overall, while 21% ranked LTC a perfect score.
Customer Importance Factors
A key aspect of the Voice of the Customer program is the manner in which it allows the customer to identify the most important factors from their perspective that would result in their satisfaction with the service. Respondents were asked to rate each factor on a scale in terms of importance. Further commentary with respect to both perceived and actual performance against importance factors is set out in Staff Report #11 – 2019 Annual Service Performance Report – Conventional Transit Service, dated March 27, 2019.
Customer Satisfaction Index
The final piece of the Voice of the Customer survey process is the creation of the Customer Satisfaction Index. This index takes the six most important factors as identified by LTC customers, and compares actual performance with respect to each factor as well as customer perception of performance against each factor. These results are combined to arrive at a total Customer Satisfaction Index score out of 100.
In order to determine actual performance against each of the identified factors, administration worked with TransPro representatives to identify a means of measuring actual performance against each factor, details of which are set out below:
- On-time Performance – % of time points from which buses depart within 0-5 minute on time window
- Frequency of Service – % of routes meeting service level standards for frequency
- Service Availability – % of routes meeting service level standards for service span
- Service Coverage – % of population within 400 metres of a bus stop
- Safety – number of preventable accidents per 100,000 kilometers travelled
- Travel Time – % deviation in travel time between auto and bus for key identified origins and destinations
The results of these measures as well as the weighting of each are compiled to complete the Customer Satisfaction Index, as set out below.
| Actual Performance | Customer Impressions | ||||||||
| Operational Metric | Goal | Goal Points | Q4 ’17 Result |
Actual Points | CSI Metric | Goal | Goal Points | Q4 ’17 Result |
Actual Points |
| Fixed route OTP | 80% | 19 | 71% | 16.9 | On-time performance | 60% | 19 | 49% | 15.5 |
| Frequency of Service | 100% | 7 | 95% | 6.7 | Frequency of Service | 75% | 7 | 56% | 5.2 |
| % compliance with Service Availability | 100% | 7 | 97% | 6.8 | Hours of Operation | 75% | 7 | 68% | 6.3 |
| % population within 400m of service | 78% | 6 | 72% | 5.6 | Service Coverage | 85% | 6 | 77% | 5.4 |
| Accidents per 100,000 kms | 1 | 5 | 1.4 | 3.2 | Safety | 87% | 5 | 89% | 5.1 |
| Deviation from car travel time | 129% | 6 | 131% | 5.9 | Travel Time | 80% | 6 | 76% | 5.7 |
| Total Customer Perception | |||||||||
| Total Actual Performance | 50 | 45.1 | 50 | 43.2 | |||||
| Total Customer Satisfaction Index = 88.3 | |||||||||
When considering the scorecard, it is important to note that the goals were established in consultation with TransPro representatives, and are intended to reflect what is reasonable and possible in current conditions subject to known resource and budget limitations; not necessarily what the ultimate goal should be. It can be expected that as the implementation of the next five year Service Plan continues, and service improvements are made, that these goals will be revised.
Administration will continue to consider other potential measures to gauge actual performance relating to safety noting it is acknowledged that the measure of accidents may not correspond to the customer’s thoughts when determining their feeling of safety as it relates to the transit service. Any changes relating to this metric and measure will be incorporated into the next survey.
Industry Benchmarking
A number of Canadian transit systems (Toronto, Laval, Strathcona, London, Mississauga, Brampton, Saskatoon, Moncton and Edmonton) have agreed to participate in the Voice of the Customer pilot program in an effort to provide the group with benchmarking opportunities. While it is recognized that each system may have specific topics they wish to survey their riders on, the group agreed to a number of standard questions that would be included on all surveys. The initial plan was to have all systems in the group complete surveys in the fall of 2017, however a number were not able to complete the surveys within that timeframe. Participants were aiming to have surveys completed for 2018, with the results to be shared at a future CUTA conference.
Specialized Transit Survey
As indicated earlier in this report, 2018 was the first year that a Voice of the Customer survey was undertaken for Specialized Transit customers. For this survey wave, 151 surveys were undertaken via telephone with customers who had utilized the service within the past six months.
Customer Characteristics
The demographic data gathered through the surveys indicates the following with respect to LTC customers:
- 67% of respondents indicated LTC specialized service as their primary method of transportation
- the majority (72%) of LTC customers are aged 60 or higher
- the gender split between riders is 72% female and 28% male
- to/from medical appointments and leisure are the two primary reasons for travel amongst LTC specialized riders, accounting for 75% of riders combined
- 36% of respondents had taken trips on conventional service in the past year
Three Day Booking Window
Respondents to the 2018 survey were asked to rate their level of satisfaction with the current three day booking window, of which 34% indicated they were satisfied, and of the 66% that were not satisfied, 93% indicated they would prefer a shorter booking window.
While many customers indicate they would like a shorter booking window, this commentary is often made under the assumption that they would be able to secure any trip they required on the day of the trip. The current three day window, which requires customers to call three days in advance of the day of travel to book a trip, provides additional opportunities for customers to call on the second and last day before travel in an effort to secure a booking they were unable to get initially. The nature of specialized services, being pre-booked, results in customers cancelling trips, and as such, as these spaces are freed up, others have the opportunity to utilize them. A move to a one day or same day booking window would not provide the same opportunity. As set out in Staff Report #8 – 2019-2022 Business Plan, dated March 27, 2019, dated March 27, 2019, a review of the booking window and options to amend it is included in the Business Plan as a priority project to be completed in the period 2019-2022.
Safety
Specialized Service drivers provide assistance to customers while boarding the vehicle including securing mobility devices to the on-board securement system and strapping down any assistive devices such as walkers. The table below sets out the responses to questions regarding feelings of safety while utilizing the specialized service.
Customer Satisfaction Level – Safety While Using Specialized Service
| Statement | 2018 |
| I feel safe while boarding the vehicle | 94% |
| I feel safe while riding the vehicle | 94% |
As the table indicates, Customers expressed a high level of satisfaction with the safety of the specialized service.
Net Promoter Score
Survey respondents were asked to rate how likely they would be to recommend LTC’s Specialized Service on a scale of 0-10, with 0 being very unlikely and 10 being very likely. The NPS is arrived at by subtracting the percentage of detractors (those rating from 0-6) from the percentage of promoters (those ranking from 9-10). Also included in this measure is the group considered passives (those rating from 7-8). The chart below sets out the comparison of results from the 2018 survey.
Net Promoter Score – Likelihood of Recommending LTC’s Specialized Service
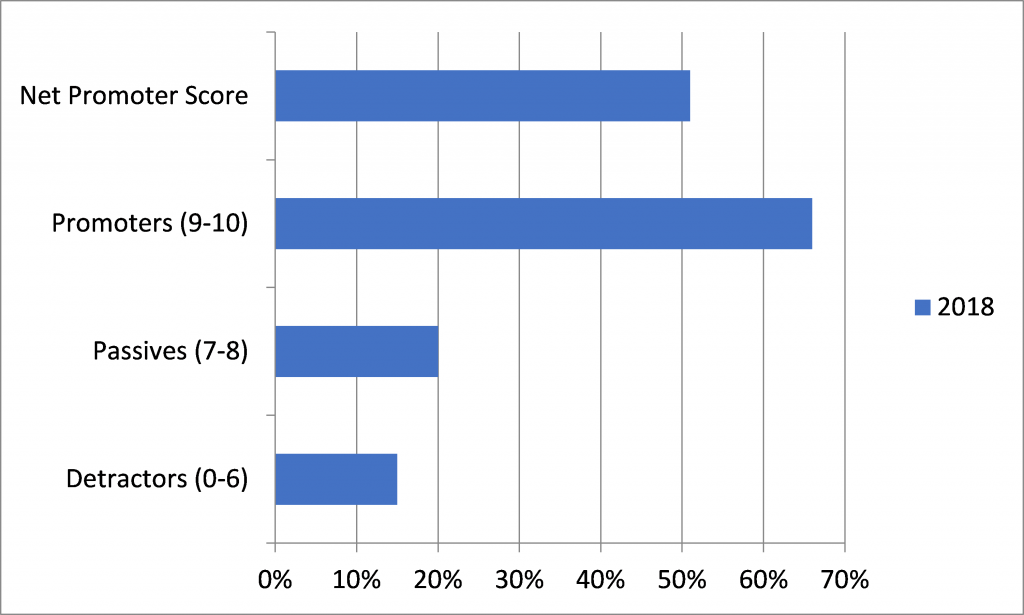
As the chart indicates, the NPS is 51%, which is significantly higher than that for the Conventional service. Net promoter scores are generally higher for specialized services given the more personalized nature of the services.
The score groupings used to determine each category and the ultimate NPS are set so this measurement can be used to compare organizations across all sectors with respect to their customer’s loyalty. However, a closer look at the breakdown of scores provides insight into the levels of satisfaction and dissatisfaction within each of the categories. The table below provides the number of responses to each of the rankings from 0 through 10.
| Ranking | Number | Percent |
| 0 | 3 | 2% |
| 1 | 0 | 0% |
| 2 | 2 | 1% |
| 3 | 3 | 2% |
| 4 | 0 | 0% |
| 5 | 12 | 8% |
| 6 | 2 | 1% |
| 7 | 8 | 5% |
| 8 | 22 | 15% |
| 9 | 11 | 7% |
| 10 | 88 | 58% |
| Total | 151 | 100% |
Using a score of 5 as the halfway mark, 13% of customers ranked LTC specialized services below a passing grade overall, while 58% ranked LTC a perfect score.
Customer Importance Factors
A key aspect of the Voice of the Customer program is the manner in which it allows the customer to identify the most important factors from their perspective that would result in their satisfaction with the service. Respondents were asked to rate each factor on a scale in terms of importance. Further commentary with respect to survey results set out in Staff Report #12 – 2019 Annual Service Performance Report – Specialized Transit Service, dated March 27, 2019.
The following lists the top six factors, in order of importance from the respondent’s perspective as well as the satisfaction rating for each.
Customer Satisfaction Levels with Key Importance Factors
| Priority | Measure | Ranking |
| 1 | Trip Availability | 72% |
| 2 | Vehicles Arrive on Time | 84% |
| 3 | Availability of Booking Agents | 51% |
| 4 | Drivers being Friendly and Helpful | 93% |
| 5 | Safety on the Vehicle | 94% |
| 6 | Booking a Trip is Easy | 51% |
Customer Satisfaction Index
The final piece of the Voice of the Customer survey process is the creation of the Customer Satisfaction Index. This index takes the six most important factors as identified by LTC customers, and compares actual performance with respect to each factor as well as customer perception of performance against each factor. These results are combined to arrive at a total Customer Satisfaction Index score out of 100.
Given this is the first wave of survey conducted for the specialized service, follow up work is required with respect to identifying the most appropriate means to measure actual performance for each of the identified key priorities as well as targets for each. This report will also be shared with the Accessible Public Transit Service Advisory Committee for their feedback.
Enclosures
I – Voice of the Customer Survey Results – Conventional (for Commissioners only)
II – Voice of the Customer Survey Results – Specialized (for Commissioners only)
Recommended by:
Katie Burns, Director of Planning
Shawn Wilson, Director of Operations
Caroline Roy, Manager of Corporate Communications
Craig Morneau, Director of Fleet & Facilities
Christopher Murphy,Supervisor, LCTB
Concurred in by:
Kelly S. Paleczny, General Manager