To All Commissioners
Re: Voice of the Customer – 2017 Survey
Recommendation
That the report be NOTED and FILED.
Background
One of the guiding principles set out in the 2015-2018 Business Plan is to be customer-focused – striving every day to improve the customer experience. A fundamental step in moving toward being more customer-focused is to ensure that every decision made is viewed not only from a business perspective, but also from the customer’s perspective.
A key step in the drive to become more customer-focused was the introduction of the Voice of the Customer Program in 2016. The program utilizes focus groups and surveys to first identify the most important aspects of the service from the customer’s perspective, and then measures the level of perceived satisfaction against those metrics as compared to the actual performance against the metric.
In 2016 two survey waves were completed, one in July and one in November/December. After reviewing the two waves of data, it was determined that the best time to conduct the annual surveys going forward would be in November of each year, noting the ridership make-up and service conditions during this period would be the most reflective of service realities. The November time period also provides the opportunity to assess customer satisfaction post-September service changes. As such, the latest survey was conducted in November 2017 and analysis of results is found below.
For each survey, slightly over 500 surveys were undertaken with transit customers on board LTC buses, covering almost all routes in the system. The surveys were conducted during all service periods throughout the day on weekdays, Saturdays and Sundays and in quantities proportional to each route’s ridership by day of week and time period.
Customer Characteristics
The demographic data gathered through the surveys indicates the following with respect to LTC customers:
- approximately 90% of LTC customers utilize the service at least three days per week
- the majority (42%) of LTC customers are between the ages of 18 and 24
- the gender split between riders is 57% female and 43% male
- to/from work and educational institutions are the two primary reasons for travel amongst LTC riders, accounting for 86% of riders combined
Customer Safety and Security
The two survey waves conducted in 2016 included questions with respect to the riders feeling of safety, both while waiting for the bus and while riding the bus, the results of which are set out below.
2016 Customer Satisfaction Levels – Safety While Waiting for the Bus
| Satisfaction Level | First Wave | Second Wave | Average % |
| Extremely Dissatisfied | 5 | 7 | 1% |
| Dissatisfied | 16 | 14 | 3% |
| Neutral | 62 | 80 | 14% |
| Satisfied | 149 | 206 | 35% |
| Extremely Satisfied | 276 | 201 | 47% |
2016 Customer Satisfaction Levels – Safety While Riding the Bus
| Satisfaction Level | First Wave | Second Wave | Average % |
| Extremely Dissatisfied | 2 | 5 | 1% |
| Dissatisfied | 10 | 8 | 2% |
| Neutral | 40 | 53 | 9% |
| Satisfied | 125 | 181 | 30% |
| Extremely Satisfied | 331 | 261 | 58% |
As indicated in the tables above, 82% of respondents in the first two waves indicated they felt safe while waiting for the bus, and 88% of respondents indicated they felt safe riding the bus. Of note, the remaining respondents for both questions fell primarily in the neutral category.
Given the ambiguity of the aforementioned questions, it was determined that additional questions would be posed in the third wave relating to feelings of safety both while waiting and while riding the bus. The following tables set out the results of the new additional questions.
Waiting for the Bus
2017 Customer Satisfaction Levels – Safety While Waiting for the Bus
|
Question |
Total
Yes |
Male
Yes |
Female
Yes |
| Feel safe from unwanted conversation/contact while waiting for the bus? | 75% | 81% | 72% |
| Experienced unwanted conversation/contact while waiting for the bus? | 38% | 32% | 41% |
| Witnessed unwanted conversation/contact while waiting for the bus? | 43% | 40% | 45% |
As the table indicates, the overall 75% feeling safe while waiting for the bus is down from the 82% when the question was asked generically in the 2016 surveys. The breakdown between males and females illustrates that generally females feel less safe from unwanted conversation/contact while waiting for the bus.
The response rates from the last two questions are somewhat contradictory to the first, in that 38% have experienced unwanted conversation/contact, and 43% have witnessed it. Given these experience ratings, it would be expected that the first question response would be lower. In an effort to better understand the demographic impacts of the responses regarding feeling safe while waiting for the bus, the data was broken down further by age group, the details are set out in the table below. The data includes all respondents in each age group, noting there was no significant variance between male and female responses by age. The numbers in the table represent the percentage of respondents in each of the age categories that responded to the question as indicated. When considering these percentages, the relatively small sample size of the age groups <18, and >65 need to be taken into consideration, noting the total respondents in these groups were 28 and 19 respectively.
2017 Customer Satisfaction Levels – Safety While Waiting for the Bus – Responses by Age Group
|
Response |
<18 |
18-24 |
25-29 |
30-39 |
40-49 |
50-65 |
>65 |
| Don’t Feel safe from unwanted conversation/contact | 29% | 26% | 19% | 30% | 27% | 14% | 32% |
| Have Experienced unwanted conversation/contact | 39% | 35% | 37% | 45% | 35% | 25% | 32% |
| Have Witnessed unwanted conversation/contact | 43% | 43% | 46% | 41% | 43% | 28% | 42% |
As the table illustrates, the percentage of respondents who don’t feel safe waiting for the bus was consistent across all age group categories, with the 50-65 age group being the lowest. With exception of the age group 50-65, at least one third of respondents in each of the age categories have both experienced and witnessed unwanted conversation/contact while waiting for the bus.
Riding the Bus
2017 Customer Satisfaction Levels – Safety While Riding the Bus
|
Question |
Total
Yes |
Male
Yes |
Female
Yes |
| Feel safe from unwanted conversation/contact while riding the bus? | 88% | 92% | 84% |
| Experienced unwanted conversation/contact while riding the bus? | 40% | 45% | 36% |
| Witnessed unwanted conversation/contact while riding the bus? | 51% | 55% | 47% |
As the table indicates, the overall 88% feeling safe while waiting for the bus is consistent with the response when the question was asked generically in the 2016 surveys. The breakdown between males and females illustrates that generally females feel less safe from unwanted conversation/contact while riding the bus.
The response rates from the last two questions are once again somewhat contradictory to the first, in that 40% have experienced unwanted conversation/contact, and 51% have witnessed it. Given these experience ratings, it would be expected that the first question response would be lower. The data was broken down further by age group; the details are set out in the table below. Again, the data includes all respondents noting there was no significant variance between male and female responses by age.
2017 Customer Satisfaction Levels – Safety While Riding the Bus – Distribution by Age
|
Response |
<18 |
18-24 |
25-29 |
30-39 |
40-49 |
50-65 |
>65 |
| Don’t Feel safe from unwanted conversation/contact | 11% | 23% | 31% | 14% | 30% | 6% | 11% |
| Have Experienced unwanted conversation/contact | 25% | 42% | 39% | 39% | 32% | 39% | 58% |
| Have Witnessed unwanted conversation/contact | 36% | 39% | 46% | 43% | 51% | 58% | 84% |
As the table illustrates, the age groups of 25-29 and 40-49 represent the highest majority who don’t feel safe riding the bus. Over one third of the respondents in each age group have both experienced and witnessed unwanted conversation/contact while waiting for the bus.
As the table illustrates, the age group of 18-24 represent the majority of respondents who don’t feel safe riding the bus, as well as those that have experienced and witnessed unwanted conversation/contact. Consistent with the findings relating to waiting for the bus, the negative feelings relating to riding the bus also decline as age increases.
In addition to the questions above regarding riding the bus, respondents were also asked if they believe that LTC bus drivers operate the vehicle safely. The responses to this question are set out in the table below.
2017 Customer Satisfaction Levels – Bus Drivers Operate the Vehicle Safely – Distribution by Frequency of Use per Week
|
Responses |
Total |
< Once |
Once |
1-2 days |
3-4 days |
> 5 days |
| Strongly Disagree | 1% | — | — | — | — | 1% |
| Disagree | 3% | — | — | — | — | 2% |
| Neutral | 9% | — | — | 1% | 1% | 6% |
| Agree | 37% | 1% | — | 2% | 6% | 28% |
| Strongly Agree | 51% | 1% | 1% | 3% | 11% | 35% |
As the table indicates, 88% of respondents indicate they feel that LTC drivers operate the vehicles safely and this sentiment is consistent across all frequency of use categories.
The demographic analysis of the safety questions provides key insight into the groups that should be targeted in the next steps of the Travel Safe Program, which is to conduct further outreach to determine the barriers to transit use, ensure that existing safety measures are well understood, and determine additional measures that could be implemented to improve the customer experience.
The next phase of the Travel Safe rollout will be to conduct further analysis with customers to determine what would make them feel safer from unwanted contact/conversation both while waiting for and while riding the bus. The addition of lighting at all bus shelters will be a welcome improvement for customers, noting all shelters are scheduled to be replaced by spring 2018.
Net Promoter Score
Another aspect the Voice of the Customer process reveals is the organization’s Net Promoter Score (NPS) by ascertaining from the respondents based on all things considered, how likely they would be to recommend riding an LTC bus to a friend or neighbour. This metric is intended to assess loyalty and word of mouth favourability among actual customers. The interesting aspect of this measure is that it can be utilized to compare performance between organizations across different business sectors, noting the actual business offering is irrelevant in this measure, but rather the focus is on the level of satisfaction the customer feels they receive.
Survey respondents were asked to rate how likely they would be to recommend LTC on a scale of 0-10, with 0 being very unlikely and 10 being very likely. The NPS is arrived at by subtracting the percentage of detractors (those rating from 0-6) from the percentage of promoters (those ranking from 9-10). Also included in this measure is the group considered passives (those rating from 7-8).
The chart below sets out the comparison of results from each of the November surveys of London Transit customers conducted in 2016 and 2017.
Net Promoter Score – Likelihood of Recommending LTC
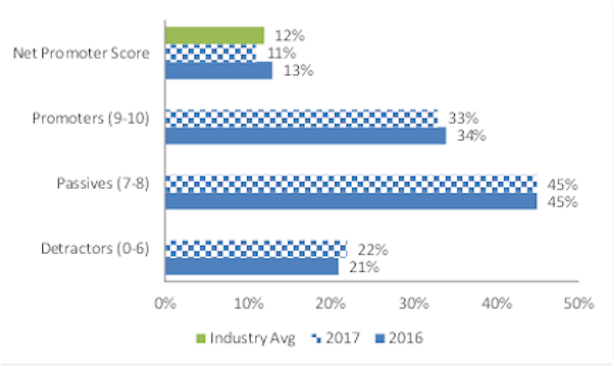
As the chart indicates, the NPS has shifted by two, down to 11%, caused by a minimal shift in both the Promoter and Detractor categories. The positive aspect of these results is that the passives are considered the most likely to be influenced to become promoters as the service metrics they identify as most important are improved.
The score groupings used to determine each category and the ultimate NPS are set so this measurement can be used to compare organizations across all sectors with respect to their customer’s loyalty. However, a closer look at the breakdown of scores provides insight into the levels of satisfaction and dissatisfaction within each of the categories. The table below provides the number of responses to each of the rankings from 0 through 10.
|
Ranking |
Number | Percentage |
| 0 | 4 | 1% |
| 1 | 3 | 1% |
| 2 | 7 | 1% |
| 3 | 14 | 2% |
| 4 | 14 | 2% |
| 5 | 31 | 5% |
| 6 | 54 | 10% |
| 7 | 113 | 20% |
| 8 | 139 | 25% |
| 9 | 79 | 14% |
| 10 | 107 | 19% |
| Total | 565 | 100% |
Using a score of 5 as the halfway mark, 12% of customers ranked LTC below a passing grade overall, while 19% ranked LTC a perfect score. The following tables provide further insight into customer rankings of overall LTC service with breakdowns by age category and frequency of use.
2017 Customer Ratings – Likely to Recommend LTC – Distribution by Age
|
Ratings |
<18 |
18-24 |
25-29 |
30-39 |
40-49 |
50-65 |
>65 |
| 0-6 (detractors) | 7% | 27% | 25% | 27% | 11% | 9% | 12% |
| 7-8 (passives) | 48% | 45% | 43% | 44% | 50% | 31% | 54% |
| 9-10 (promoters) | 48% | 28% | 32% | 30% | 39% | 60% | 35% |
While net promoter scores cannot be considered statistically valid for a number of these categories given the small sample size, the percentage allocations within each age group provides insight into the perspectives of the various groups. Of interest, with the exception of respondents aged 50-65, the majority of ratings in all age groups fell in the passive category.
2017 Customer Ratings – Likely to Recommend LTC – Distribution by Frequency of Use per Week
|
Ratings |
< Once |
Once |
1-2 days |
3-4 days |
> 5 days |
| 0-6 (detractors) | — | 14% | 3% | 15% | 36% |
| 7-8 (passives) | 40% | 43% | 80% | 34% | 34% |
| 9-10 (promoters) | 60% | 43% | 17% | 50% | 29% |
Consistent with the age group breakdown, there are a number of categories with too small a sample size to calculate a valid net promoter score; however the ratings by frequency of use also provide insights into LTC customers. Half of the respondents that indicated their frequency of use at 3-4 days per week fell into the promoter category, but moving to the frequency category of 5 or more days per week, the majority of respondents fell into the detractor category. This is likely tied to the fact that customers ranked on-time performance as the number one importance factor, and riders utilizing the service more frequently will be more likely to experience schedule adherence issues.
When cross-referencing the overall NPS with the various customer importance factors, the following key findings come to light:
- customers who rated travel time, friendly drivers, clean buses and comfort of ride as the most important had the highest net promoter scores
- customers who rated access to real-time information, schedules and maps as the most important has the lowest net promoter scores
Customer Importance Factors
A key aspect of the Voice of the Customer program is the manner in which it allows the customer to identify the most important factors from their perspective that would result in their satisfaction with the service. Respondents were asked to rate each factor on a scale in terms of importance. Further commentary with respect to both perceived and actual performance against importance factors is set out in Staff Report #3, dated February 28, 2018.
Customer Satisfaction Index
The final piece of the Voice of the Customer survey process is the creation of the Customer Satisfaction Index. This index takes the five most important factors as identified by LTC customers, and compares actual performance with respect to each factor as well as customer perception of performance against each factor. These results are combined to arrive at a total Customer Satisfaction Index score out of 100.
In order to determine actual performance against each of the identified factors, administration worked with TransPro representatives to identify a means of measuring actual performance against each factor, details of which are set out below:
- On-time Performance – % of time points from which buses depart within 0-5 minute on time window
- Service Availability – % of routes meeting service level standards for frequency and service span
- Service Coverage – % of population within 400 metres of a bus stop
- Safety – number of preventable accidents per 100,000 kilometers travelled
- Travel Time – % deviation in travel time between auto and bus for key identified origins and destinations
The results of these measures as well as the weighting of each are compiled to complete the Customer Satisfaction Index, as set out below.
| Actual Performance | Customer Impressions | ||||||||
| Operational Metric | Goal | Goal Points | Q4 ’17 Result |
Actual Points | CSI Metric | Goal | Goal Points | Q4 ’17 Result |
Actual Points |
| Fixed route OTP | 80% | 17 | 71% | 15.1 | On-time performance | 60% | 17 | 52% | 14.7 |
| % compliance with guidelines | 85% | 10 | 89% | 10.4 | Service Availability | 75% | 10 | 68% | 9.1 |
| % population within 400m of service | 75% | 9 | 72% | 8.7 | Service Coverage | 85% | 9 | 79% | 8.4 |
| Accidents per 100,000 kms | 1 | 7 | 0.9 | 7.7 | Safety | 87% | 7 | 87% | 7.0 |
| Deviation from car travel time | 129% | 7 | 131% | 6.9 | Travel Time | 80% | 7 | 78% | 6.8 |
| Total Customer Perception | |||||||||
| Total Actual Performance | 50 | 48.8 | 50 | 46.0 | |||||
| Total Customer Satisfaction Index = 94.8 | |||||||||
When considering the scorecard, it is important to note that the goals were established in consultation with TransPro representatives, and are intended to reflect what is reasonable and possible in current conditions subject to known resource and budget limitations; not necessarily what the ultimate goal should be. It can be expected that as the implementation of the five year Service Plan continues, and service improvements are made, that these goals will be revised.
Administration will continue to consider other potential measures to gauge actual performance relating to safety noting it is acknowledged that the measure of accidents may not correspond to the customer’s thoughts when determining their feeling of safety as it relates to the transit service. Any changes relating to this metric and measure will be incorporated into the next survey.
Industry Benchmarking
A number of Canadian transit systems (Toronto, Laval, Strathcona, London, Mississauga, Brampton, Saskatoon, Moncton and Edmonton) have agreed to participate in the Voice of the Customer pilot program in an effort to provide the group with benchmarking opportunities. While it is recognized that each system may have specific topics they wish to survey their riders on, the group agreed to a number of standard questions that would be included on all surveys. The initial plan was to have all systems in the group complete surveys in the fall of 2017, however a number were not able to complete the surveys within that timeframe. Participants are aiming to have surveys completed no later than spring 2018, with the results to be shared at the 2018 CUTA conference in November 2018.
Enclosure
I – Voice of the Customer Survey Results (Commissioners only)
Recommended by:
Katie Burns – Director of Planning
Shawn Wilson – Director of Operations
Concurred in by:
Kelly S. Paleczny – General Manager