Staff Report #2
October 30, 2019
To All Commissioners
Re: Preliminary Assessment of Speed Limit Reduction Impacts
Recommendation
That the Commission CONFIRM the following feedback be provided to civic administration with respect to the potential impacts of a reduced speed limit on area collectors to public transit services;
- The anticipated impact on the conventional transit service as the result of a reduction in speed limit on area collectors is significant.
- The manner in which the issue is addressed will result in either significant operating and capital cost increases or significant negative impacts on service (the Route 15 example from this report will be included)
- While not assessed, lower speed limits on area collectors are also likely to have an impact on the productivity of the specialized services, resulting in fewer trips per hour, and less ridership
- A minimum of nine months’ notice (prior to the fall service implementation period) is required prior to the speeds being altered on area collectors in order to provide time for the affected schedules to be changed and implemented. In addition, should additional buses be required to undertake the changes, a minimum one year notice would be required.
Background
At the October 1, 2019 meeting of Municipal Council, the following motion was passed with respect to adjustments to the speed limits in the City.
That the following actions be taken with respect to area speed limit:
a) the Civic Administration BE DIRECTED to implement the Area Speed Limit program or 40 km/h default speed limit will be established on local streets and Area Speed Limit zones will also be designated Community Safety Zones; and
b) the following additional considerations BE REFERRED back to the Civic Administration in order to allow for consultation with the London Transit Commission:
i) consideration of the implementation of the 40 km/h speed limit on collector roads;
ii) consideration of the implementation of the 40 km/h speed limit also be applied to the following arterial roads, and the area they encompass, within the downtown area to reflect the high level of pedestrian and cyclist activity:
A. King Street from Thames Street to Colborne Street;
B. Pall Mall Street from Richmond Street to Wellington Street;
C. Queens Avenue from Colborne Street to Ridout Street North;
D. Richmond Street from Horton Street East to Oxford Street East;
E.Wellington Street from Horton Street East to Pall Mall Street;
iii) reduction of the School Zone speed limits from 40 km/hr, to 30 km/hr on local streets.
Subsequent to being advised of this motion, Administration undertook to determine the best way to assess the impacts to transit service as the result of a potential reduction in speed limit to 40km/h on collector roads as well as those listed additionally above. While there is no timeframe provided in the motion with respect to the consultation, civic administration has inquired as to how quickly feedback from London Transit could be provided. In an effort to have materials for discussion at the October Commission meeting, a high level approach to the assessment was undertaken.
The summary section of this report outlines the feedback that is being recommended to be provided to civic administration with respect to the impacts of a reduced speed limit to 40 km/h on the conventional transit services, which is based on this high level assessment. As indicated later in the report, should a detailed assessment of each route be required, external resources would be needed, and it is anticipated the earliest this work could be completed would be by the end of the first quarter 2020.
Route Make-Up
In an effort to assist the reader in understanding the methodology utilized to assess the impacts of a lower speed limit, the following provides an overview of the make-up of a conventional transit route, and a description of how they are created.
When attempting to simplify the costs associated with the delivery of public transit the statement “time is money” is often used. While simple and to the point, the statement is also accurate. Every minute that a bus is running costs money; whether it be travelling to/from the Route it operates on, in service picking up passengers, waiting at a recovery point to allow the Operator an opportunity to use the facilities, or being serviced for the next day. When route schedules are created, significant effort is placed on making the schedule as efficient as possible. Consideration is given to the traffic conditions, speed limits on the corridors travelled, the number of turns and whether they are signalized, passenger loads, number and frequency of stops, and connections to other routes. This analysis is completed for each time period that the service will operate (AM Peak, Base, PM Peak, and Evening). The graphic below provides a visual of a Route schedule.
Visual of Simplified Route Schedule – Weekday Base Period Service
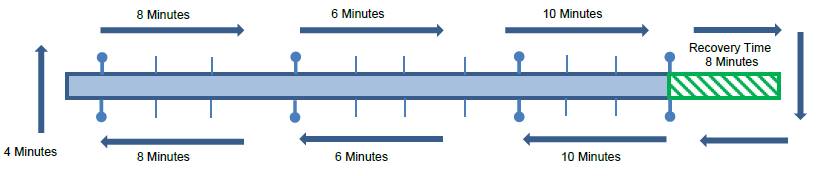
The hash marks in the diagram represent bus stop locations, with the bolder marks with the dots representing time points. In the simplified diagram above, the total round-trip time for the route is 60 minutes, meaning each bus operating on the route would require 60 minutes to serve the entire route. The route is made up of a number of elements, each of which is described below:
- Stops – represented in the diagram by hash marks, are each of the designated stops along the route. The Operator will only stop at these locations in the event that a passenger wants to board or exit the bus.
- Time Points – represented in the diagram by bolder marks with a dot on top, are the stops along the route for which a time is provided for in the route schedule. In the case of time points, Operators will not pass or leave a time point prior to its scheduled time. Time points are also utilized when planning the transit network, as time points often represent stops that passengers may need to transfer to another route. In these cases, careful consideration is given to ensuring the time points for the connecting routes are scheduled in a manner to provide for convenient transfers.
- Recovery – represents the time allocated at a specific point in the route that provides the opportunity for the Operator to get the bus back on schedule if need be, as well as the opportunity to utilize the facilities nearby. The rule of thumb utilized by administration when creating schedules is that a minimum of 10% of the total running time of the route be dedicated to recovery. These locations are selected in an effort to provide a washroom facility for Operators, while at the same time ensuring the bus is not left idling for an extended period in a location that causes disruptions to traffic.
Recovery time in a route can be greater than 10%, and while this means the route is less efficient, it is done in an effort to balance the buses on the route. Depending on the running time of the route and the desired frequency, the connectivity requirements for transfers with other routes, and the scheduling for multi-use stops, there may be a requirement to include a longer recovery time. As will be discussed later in this report, if a route with greater than 10% recovery time is assessed to have schedule adherence issues, the schedule can be adjusted without the requirement for additional hours of service. Similarly, in some cases, the frequency of a route with greater than 10% recovery time can be increased without the requirement for additional hours. Routes that are operating with the minimum 10% recovery time however have no flexibility to be altered without the requirement of an additional bus and hours.
It is important to recognize that the example provided would not be accurate for all time periods during the service day. As indicated earlier, the round-trip running time of a route is impacted by a number of factors which change throughout the service day. As a result, the schedules for the route are changed to match those conditions. The time periods that service is broken into on weekdays and weekends are set out in the following table.
| Weekday Time Periods | Saturday Time Periods | Sunday Time Periods | ||
| Early AM (6am to 7am) | Early AM (6am to 8am) | Early AM (7am to 9am) | ||
| AM Peak (7am to 9am) | Base (8am to 10am) | Base (9am to 12pm) | ||
| Base (9am to 2pm) | Peak (10am to 6pm) | Peak (12pm to 6pm) | ||
| PM Peak (2pm to 7pm) | Early Evening (6pm to 9pm) | Evening (6pm to end of service) | ||
| Evening (7pm to 9pm) | Late Evening (9pm to end of service) | |||
| Late Evening (9pm to end of service) |
Referring back to the example route set out in the diagram, while the round trip running time may be 60 minutes for the weekday base period, a total running time for the same route will be something greater during the AM and PM peak periods. This is due to a number of factors including the increased levels of traffic and the increased stopping and starting due to heavier passenger volumes during those periods.
The next piece to consider when assessing a route is the frequency at which the service is operating. In the example above, if a 15 minute frequency were to be provided, it would require four buses (60 min round trip time divided by the 15 min frequency). If the frequency is adjusted in the base and evening periods to 20 minutes, the route would require only three buses.
As this section illustrates, there is not an easy way to assess the impact of a speed limit change on a route without undertaking a detailed assessment covering all time periods for weekdays, Saturday and Sunday service.
High Level Assessment
As a first step, all routes were assessed in an effort to determine the level of potential impact, based on factors including the corridors on which they travel, the spacing between stops, how tightly the current schedule runs, passenger loads by route, and how much of the route is impacted by the reduced speed limit. What has not been included in this assessment is the fact that a reduction in speed limit along a corridor will result in all traffic moving more slowly, which could result in increased congestion.
The following table sets out the results of this assessment, noting the impact assessments are based on the following criteria.
- High – Routes operate mostly on corridors that are proposed to have a speed limit reduction. Adding time to offset the speed limit reductions would result in recovery time below the 10% target and therefore cannot be accommodated in the existing schedule without impacting frequency.
- Medium – Routes operate a significant portion along corridors with proposed speed limit reductions, however less than those listed as high. There may also be some more flexibility in the current schedule during certain time periods and may not require an additional peak period bus, but will likely require additional hours during some operating periods.
- Low – Routes operate on limited corridors with proposed speed limit reductions and it is assumed that the limited additional time required can be accommodated for within the existing schedules.
- Limited – Routes have very limited or no operation along corridors with proposed speed limit reductions. It is not anticipated that there will be an impact to the existing schedule on these routes.
Route Assessment – Impact of Reduced Speed Limits
| Route | Impact | Route | Impact | |
| 1 | High | 27 | Low | |
| 2 | Low | 28 | Low | |
| 3 | Limited | 30 | Limited | |
| 4 | High | 31 | High | |
| 5 | Low | 33 | Medium | |
| 6 | Medium | 34 | High | |
| 7 | Medium | 35 | Medium | |
| 9 | High | 36 | Limited | |
| 10 | Limited | 37 | Limited | |
| 12 | Limited | 90 | Limited | |
| 13 | Limited | 91 | Limited | |
| 15 | High | 92 | Limited | |
| 16 | Limited | 93 | Low | |
| 17 | Low | 94 | Low | |
| 19 | Medium | 102 | Medium | |
| 20 | High | 104 | High | |
| 24 | Medium | 106 | Medium | |
| 25 | Limited |
Subsequent to this assessment, one of the routes assessed as “high” (Route 15) was selected for a detailed analysis. Data from the on-board metrics was reviewed for the period of 7am to 7pm on a weekday to determine the speeds at which the bus operated during the entire twelve hour period. The assessment was done over this period in an effort to determine the varying impacts during the AM Peak, Base and PM Peak operating periods, noting it was assumed that the Evening period would operate similar to the Base period. For each of the periods, the total time that the bus operated above 40 km/h were calculated, and then adjusted down to 40 km/h to determine the additional time that would be required to travel the same route.
The results of the detailed assessment for Route 15 on a weekday over the period concluded the following:
- AM Peak (7am-9am) – an additional 2 minutes and 12 seconds per hour, per bus would be required to travel the same distance. During this period, this additional time can be accommodated within the existing schedule.
- Base (9am to 2pm) – an additional 4 minutes and 8 seconds per hour per bus is required. The current schedule does not have adequate time to allow for this while maintaining a 10% recovery time, and as such, an extra bus would need to be added to continue to operate during this period at the same frequency.
- PM Peak (2pm to 7pm) – an additional 2 minutes and 26 seconds per hour per bus is required. The current schedule does not have adequate time to allow for this while maintaining a 10% recovery time, and as such, an extra bus would need to be added to continue to operate during this period at the same frequency.
Extrapolating the results from the detailed assessment above, the following assumptions were made for the remaining weekday periods.
- Early AM (6am to 7am) – it is assumed this period would operate similar to the AM Peak period, and there would be adequate time in the schedule to accommodate the changes.
- Evening (7pm to 9pm) – it is assumed this period would operate similar to the Base period, and there would not be adequate time in the schedule while maintaining a 10% recovery time, requiring the addition of a bus to maintain the same frequency.
- Late Evening (9pm to end of service) – it is assumed this period would also operate similar to the Base period; however, the Late Evening schedules have adequate time to allow for this to be accommodated within the existing schedule.
A similar extrapolation of the detailed assessment was applied to weekend periods, with the results as follows.
- Early AM (start of service to 8am) – it is assumed that weekend services would operate similar to Early AM weekday service, and as such, there would be adequate time in the schedule to accommodate the changes.
- Base (8am to 10am) – it is assumed that weekend services would operate similar to the Base weekday period, and as such, there would not be adequate time in the schedule while maintaining a 10% recovery time, requiring the addition of a bus to maintain the same frequency.
- Peak (10am to 6pm) – it is assumed that weekend services would operate similar to the Base weekday period, and as such, there would not be adequate time in the schedule while maintaining a 10% recovery time, requiring the addition of a bus to maintain the same frequency
- Early Evening (6pm to 9pm) – it is assumed that weekend services would operate similar to the Evening weekday period, and as such, there would not be adequate time in the schedule while maintaining a 10% recovery time, requiring the addition of a bus to maintain the same frequency
- Late Evening (9pm to end of service) – it is assumed that weekend services would operate similar to the Late Evening weekday period, and as such, there would be adequate time in the schedule to accommodate the changes.
Based on the above results and extrapolations, the impact to weekday services in order to maintain the current frequencies would be an additional bus from 9am to 9pm (12 hours per day), for a total of 3,120 annualized service hours. Similarly, the impact on weekend services in order to maintain the same frequencies would be an additional bus from 8am to 6pm (10 hours per day), for a total of 1,040 hours. In total, the annualized operating impact on the route assessed would be the requirement of an additional 4,160 hours. In addition, given the bus would be required during peak operating periods on weekdays, one expansion bus would also be required. In terms of actual costs, if the direct operating cost per service hour for the 2020 budget ($114 per hour) is applied to the total hours, the total cost of the additional hours would be approximately $474,000. In addition, the capital cost of an expansion bus is approximately $600,000 for a 40 foot bus including all required ancillary equipment. It is recognized that this assessment makes a number of assumptions. In the event the speed limits are reduced, actual schedules would be re-created based on current frequencies, which could result in variations from these estimates.
An alternative to increasing the hours and buses allocated to the route would be to reduce the frequency. In the case of Route 15, the additional time required would result in a 17 minute frequency (up from 15 minutes) during weekday Base and PM Peak periods, from 30 to 33 minutes on weekends during peak periods and from 60 to 63 minutes during weekend Evening periods. Increasing frequencies in order to accommodate the changes to speed limits system wide will inevitably undo many of the improvements made over the last Five Year Service Planning period in an effort to make the system as a whole more attractive. Additionally, as set out in Staff Report #1, dated October 30, 2019, one of the strategic directions in the 2020-2024 Service Plan Framework is to improve frequencies system wide, as well as eliminate any 60 minute frequencies. While it may seem like a minor change to adjust frequencies by two to three minutes, the route cannot be looked at in isolation. Adjusting the frequencies may result in extended waits for transfers with connecting routes, bunching of buses at multi-use stops, and more difficult schedules for customers to understand, noting they would no longer be operating on a clock-face frequency. As such, increasing frequencies is not the approach recommended to address the operational impacts of a reduced speed limit.
Overall Impacts
Given the significant resource requirement associated with the detailed analysis, only one route has been assessed. In order to provide an estimated order of magnitude impact on the system as a whole as the result of a reduction in speed limit to 40 km/h, the route assessment conducted on Route 15 will be relied upon below.
There were a total of eight routes that were assessed as “high” in terms of the likelihood of being impacted by the change, all with similar operating characteristics to the Route 15 which was assessed in detail. Applying the same additional required annual hours to each of these routes would result in a total service hour required for all of the eight routes of 33,280 hours. In order to address this within the current operating budget allocations, and assuming no changes would be in place until fall of 2020 given there is no budget allocation to make any schedule adjustments prior to that time, would require the total 18,000 hours budgeted for service improvements in 2020 as well as 15,280 hours from the 2021 service plan. As indicated earlier, in the event the speed limits are reduced, actual schedules would be re-created for all affected routes based on current frequencies, which could result in variations from these estimates.
Alternatively, the annualized budget increase required to address this would be an additional $3.4 million. In the event this additional funding was available, additional resources would be required in order for administration to complete the schedule rewrites for the 2020 and 2021 service plans as well as those required for the change in speed limit. As set out in Staff Report #1, dated October 30, 2019, significant resources are required to undertake schedule changes of this magnitude, and as such, if the reduction in speed limit was confirmed by January 1, 2020, the earliest the required changes to schedules could be implemented would be September 2020.
The adjustments above would also require eight expansion buses, given the adjustments to schedules would be required in peak operating periods. The current capital plan calls for four expansion buses in 2020 and five in 2021, all with the exception of one would be required to address this issue. Alternatively, an additional eight expansion buses could be purchased at an estimated cost of $4.8 million, noting current delivery timelines, these buses would not be available until 2021.
It is recognized that this approach has not provided for a detailed route by route analysis, nor has any attempt at analysis been undertaken for a route that has been assessed as having a medium likelihood of being impacted. However, the assessment undertaken to date clearly indicates the potential for significant impacts to the conventional transit service in relation to a decreased speed limit regardless of the approach taken. If the approach is to request additional operating and capital budget dollars to accommodate the required schedule changes, the request will be substantial, noting prior to making a request of this nature, detailed assessments of each route potentially impacted would need to be undertaken. If the approach is to accommodate the required schedule changes within existing budget requests, 92% of the increased hours for the first two years of the Five Year Service Plan Framework would be required, resulting in no service improvements for 2020 or 2021. Finally, if the approach is to increase frequencies to accommodate the required schedule changes, the result would be the undoing of many of the improvements to the service made over the last number of years, resulting in a less reliable transit service which is counter to the Five Year Service Plan Framework as well as the Commissions 2019-2022 Business Plan.
Once Municipal Council has made a decision with respect to the speed limit reductions on collector roads, administration will prepare a report outlining the recommended options moving forward. In order to ensure Municipal Council is making an informed decision, the following section of the report outlines the key messages that will be shared with civic administration with respect to the proposed speed limit reduction.
Next Steps
Administration will prepare a document to respond to civic administration based on the details included in this report, highlighting the following key points:
- The anticipated impact on the conventional transit service as the result of a reduction in speed limit on area collectors is significant.
- The manner in which the issue is addressed will result in either significant operating and capital cost increases or significant negative impacts on service (the Route 15 example from this report will be included)
- While not assessed, lower speed limits on area collectors are also likely to have an impact on the productivity of the specialized services, resulting in fewer trips per hour, and less ridership
- A minimum of nine months’ notice (prior to the fall service change period) is required prior to the speeds being altered on area collectors in order to provide time for the affected schedules to be changed and implemented. In addition, should additional buses be required to undertake the changes, a minimum one year notice would be required.
Recommended by:
Shawn Wilson, Director of Operations
Katie Burns, Director of Planning
Concurred in by:
Kelly S. Paleczny, General Manager