Staff Report #3
June 26, 2019
To All Commissioners
Re: Fare Strategy
Recommendation
That the Commission:
i. CONFIRM the fare pricing and media strategy objectives and principles as set out below:
Fare pricing and media strategy objectives:
- meet established transportation revenue requirements;
- maintain and build ridership, mitigating the traditional ridership loss associated with fare increases; and
- ensure that fare administration is both effective and efficient, balancing fare administration cost, fare validation requirements and customer convenience.
The fare pricing and media strategy reflects the following principles:
- customers want a service that provides direct travel that is convenient, reliable, safe, and affordable;
- customers are sensitive to savings;
- fare pricing and media options can influence service use;
- customers will pay for service quality;
- that it is beyond the mandate and expertise of London Transit to effectively resolve broader social and community issues related to income distribution; and
- that new or reduced concession fares, intend to resolve broader social and community issues relating to income distribution be considered if arrangements are made to subsidize London Transit for the associated loss of revenue – noting such subsidy is not a public transit subsidy but a subsidy supporting a defined group’s use of the service.
ii. DIRECT administration to utilize the fare strategy objectives and principles in the development of the multi-year budget to be tabled for consideration at the August meeting, noting same will include a recommended fare increase(s).
Background
The fare program, and fares in general, with the exception of the introduction of a number of subsidized fare programs were last changed in January 2008. The current fare structure in use at London Transit has four primary categories; cash, tickets, monthly passes and tuition passes. The current fare table is set out below.
London Transit Commission Fares – Effective April 1, 2019
| Category | Fare |
| Cash(1) | |
| Adult, Senior, Student | $2.75 |
| Child (12 and under) | Free |
| Tickets(1,2) | |
| Adult | 5 for $9.50 ($1.90/trip) |
| Senior (65 and over) | 5 for $7.15 ($1.43/trip) |
| Student (grade 7-12) | 5 for $7.70 ($1.54/trip) |
| Passes (Monthly)(3) | |
| Citipass (unlimited & transferable) | $81.00 |
| Weekday (Mon-Fri only) | $69.00 |
| Income-Related | $52.00 |
| Youth (age 13-17) | $52.00 |
| Student Summer (2 months) | $81.00 |
| Post-Secondary | $70.00 |
| Park and Ride | $60.00 |
| Tuition Pass (Annual)(4) | |
| Western & Fanshawe students | $238.93 |
Notes:
- Cash and ticket fares include a 90 minute unrestricted transfer
- All ticket options also available on smart cards as stored value effective February 2019
- All monthly pass options are available only on smart cards effective April 2019
- Tuition pass fares subject to annual price increase per contracts
In 2018, $32.5 million was collected in conventional transit service fares, supporting approximately 52% of the operating costs of the service. The chart below illustrates the historic trend of the percentage of operating costs covered by fares for both LTC and its peer group which consists of all transit systems in Ontario with populations exceeding 100,000 excluding Ottawa and Toronto.
Percentage of Operating Costs covered by Fares – LTC and LTC Peer Group
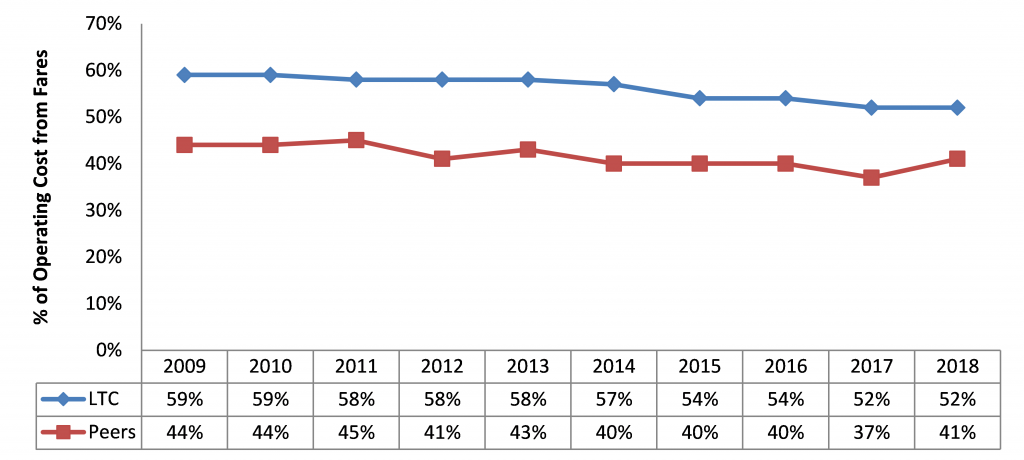
As illustrated in the chart, the percentage of operating costs that are covered by fares each year has been declining slowly but steadily. The decline from 2009 through 2014 is primarily related to the increased use of Provincial Gas Tax to cover operating costs. The further declines experienced between 2015 and 2018 are directly tied to the Commission’s decisions to forego two budgeted fare increases over the four year period and rely on Provincial Gas Tax to cover the related budget shortfall. The rationale for the decision to defer the budgeted fare increases was one of the principles in the Commission’s Fare Strategy that customers are willing to pay for a quality service. The period 2015 through 2018 saw unprecedented growth in service as compared to previous years, all of which was focused on improving the customer experience. The recommendation to defer the budgeted fare increases during this period was based on the rationale that customers would be more willing to accept higher fares when the planned service improvements were in place, providing for a more convenient and reliable transit service.
The chart above illustrates clearly that London Transit has, and continues to rely much more heavily on revenues from the fare box to support operations than other transit systems in the Province. In order to ensure these revenue targets are achieved, standards have been developed and approved by the Commission with respect to various service types. The table below sets out the level of operating cost support that must be generated by each type of service in order for the service to be considered viable based on the LTC funding structure.
Daily Service Productivity Minimum – Boardings per Revenue Vehicle Hour
| Route Type | Weekday Peak | Weekday Evening | Saturday | Sunday |
| Rapid Transit | 50 | 30 | 30 | 20 |
| Base Arterial | 50 | 30 | 30 | 20 |
| Minor Arterial | 25 | 20 | 20 | 15 |
| Local | 20 | 15 | 15 | 15 |
| Industrial | 15 | 15 | 15 | 15 |
| Express | 30 | |||
| Community Bus | 15 |
As part of the annual service planning process, all routes are assessed against the above criteria, and those that are not meeting the minimums are considered for change or removal.
Staff Report #2, dated June 26, 2019, set out an analysis of 2018 ridership with specific attention on the new fare programs that were introduced over the past 18 months. Ridership and revenue from fares go hand in hand, as confirmed by a number of underlying principles in the LTC Fare Strategy including:
- customers are sensitive to savings;
- fare pricing and media options can influence service use; and
- customers will pay for service quality
The chart below illustrates the change in the percentage of annual revenue generated from each of these primary categories over the past 10 years, noting that annual fare revenue has grown by 28% from $25.4 million in 2009 to $32.5 million in 2018.
London Transit Fare Revenue – Percentage Share by Category – 2009 through 2018
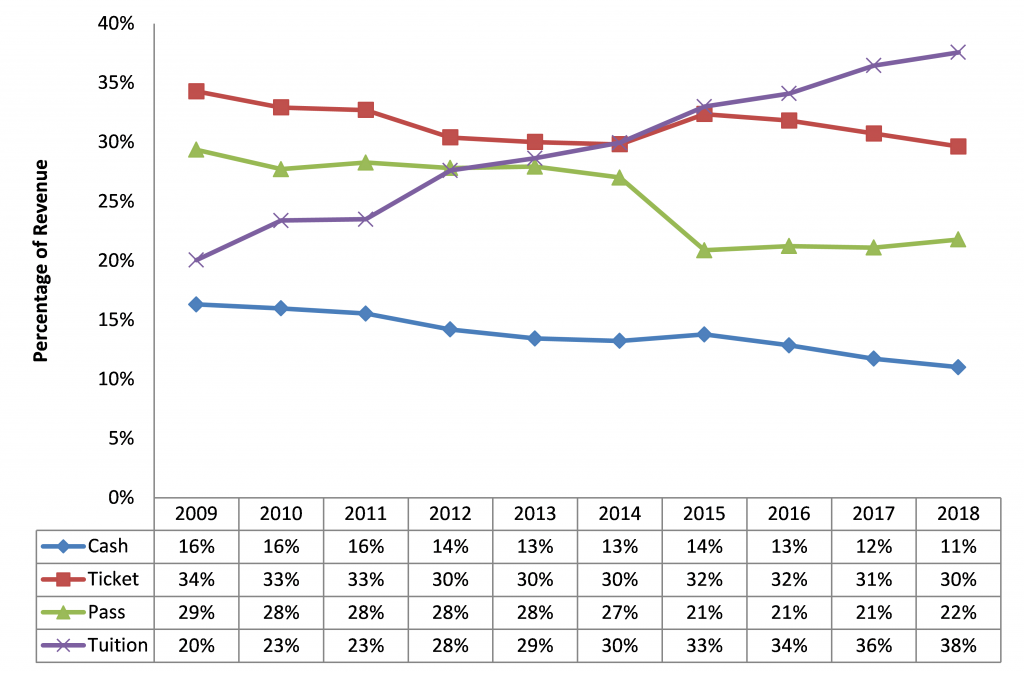
As the chart indicates, cash, ticket and pass categories have all seen downward trends in terms of percentage of total revenue over the ten year period. The tuition pass category has been the only one to climb, a combination of the increased number of tuition passes in circulation and the annual price increases associated with the tuition passes that other fare media options were not subject to.
Cash Revenue
As the chart indicates, cash revenue as a percentage of total revenue has steadily declined over the period. The declines in 2017 and 2018 are related in-part to the introduction of the free transit for riders aged 12 and under, noting this resulted in the elimination of the child cash fare, and all revenue from this program provided via subsidy is reported under the child ticket category. While cash ridership provides the highest revenue per ride (average fare in the cash category for 2018 was $2.75), it is also the most costly to process, and as such, many transit agencies utilize pricing strategies to discourage the use of cash to pay for transit. The introduction of the stored value option on smart cards is anticipated to further reduce the percentage of riders that pay with cash. There have been no changes to fare categories or pricing over the period that would have resulted in the decline in cash riders, and as such, the decline is viewed as a natural progression of London’s transit riders away from this category.
The average adult cash fare across the LTC peer group currently is $3.32, with the lowest cash fare at $2.75 and the highest at $4.00.
Ticket Revenue
As the chart indicates, ticket revenue as a percentage of totals has remained relatively static over the ten year period. The ticket category generates the second highest average fare, with an average for the entire category of ticket fare options for 2018 being $1.79 per ride. Based on the adult fare category, a transit rider would need to ride the bus 43 times in a calendar month (approximately 1.4 times per day) to make a monthly pass a more economic option than tickets. Tickets are generally priced at a discount off of the cash fare and sold in strips of five or more. This approach offers the customer with a discount from the cash fare, while at the same time requiring the purchase of multiple rides in order to get the discount.
The launch of the stored value option on smart cards in early 2019 is anticipated to see an increase in “ticket” riders going forward, noting the amount deducted for a ride on the smart card is the equivalent of a ticket fare versus a cash fare.
The average adult ticket fare across the LTC peer group currently is $2.71, with $1.90 being the lowest adult ticket fare and $3.75 being the highest.
Pass Revenue
Monthly pass revenue as a percentage of total held constant until 2015, when a change in the manner the transportation benefit component associated with Ontario Works was implemented. Subsequent to the change, the pass revenue as a percentage has remained fairly static at 21% of total, with a slight increase to 22% in 2018 resulting from the introduction of the income-related and youth pass programs, discussed in more detail later in this report. Pass riders are considered the most captive, in that, they have invested in a monthly pass that they intend to utilize to the extent necessary to get value for the dollars invested. While fare pricing plays a role in the choice of fare category, the delivery of a frequent and reliable public transit service that meets the needs of more Londoners is the most effective way to shift riders to the monthly pass category.
The average adult monthly pass price across the LTC peer group currently is $99.46, with the lowest monthly pass at $76 and the highest at $150.
Tuition Pass Revenue
Tuition pass revenue has steadily increased as a percentage of totals over the ten year period.
Tuition ridership and related revenue is directly tied to enrollment at the participating institutions, both of which have experienced significant increases over the ten year period illustrated in the chart. The total number of students receiving an annual tuition pass in 2018 was 53,400, up 29% from the 41,400 students in 2009.
Unlike the other fare categories, which have not seen an increase in fares since 2008, the tuition pass contracts that are in place include the provision for annual price increases. Over the period of 2009 through 2018, the cost of the tuition pass has increased approximately 46%, and now sits at $238.82 for a 12 month pass. The unique feature of the tuition pass program is that it is universal in nature, meaning that all students pay for the transit pass whether they use transit or not. This provides for a cross-subsidization within the program, with infrequent or non-transit users subsidizing the pass cost for frequent users. The other unique feature of this fare category is that it provides a steady and reliable revenue stream that can be built into budgets and utilized to support service growth.
2018 Fare Revenue Assessment
In preparation for the next multi-year budget cycle, the conventional transit ridership and related revenue for 2018 was analyzed in an effort to determine trends as well as impacts from the various fare subsidy programs put in place in the recent past.
London Transit Ridership Comparison – 2018 vs 2017
| Ridership | 2017 | 2018 | Variance |
| Cash | 1,335,133 | 1,301,876 | -2.5% |
| Ticket | 5,288,666 | 5,384,201 | 1.8% |
| Monthly Pass | 4,341,616 | 4,732,020 | 9.0% |
| Tuition Pass | 11,956,128 | 12,327,971 | 3.1% |
| Total | 22,921,543 | 23,746,068 | 3.6% |
| Revenue | |||
| Cash | $3,671,615 | $3,508,159 | -4.5% |
| Ticket | 9,614,287 | 9,627,074 | 0.1% |
| Monthly Pass | 6,604,372 | 7,153,145 | 8.3% |
| Tuition Pass | 11,410,280 | 12,209,065 | 7.0% |
| Total | $31,300,554 | $32,497,443 | 3.8% |
As the table indicates, 2018 saw a 3.8% increase ($1.197 million) in revenue over the previous year, with the gains being experienced in the monthly and tuition pass categories. Direct, year over year comparison of the various ridership categories is not as straightforward an exercise for 2017 and 2018 as it has been in the past given the number of subsidized transit fare programs that have been implemented in the last 18 months. In order to better understand the overall trend, each of the new programs must be isolated and assessed on their own to determine the individual impacts each of the subsidized fare programs has had on revenue from ridership. A summary of the revenue impacts of each program is set out in the table below.
2018 Fare Revenue Impacts of Subsidized Transit Programs
| Fare Category | Free Fare 12 & Under | Income Related Pass | Senior Discount Elimination | Youth Pass | Total |
| Ticket | |||||
| Adult | $ 645,143 | $ 645,143 | |||
| Student | (74,129) | (74,129) | |||
| Senior | (636,499) | (636,499) | |||
| Child | 422,804 | 422,804 | |||
| Passes | |||||
| Citipass | (185,409) | (114,048) | (299,457) | ||
| Weekday | (23,253) | (23,253) | |||
| Senior | (471,845) | (471,845) | |||
| Income Related | 1,095,024 | 1,095,024 | |||
| Youth | 239,362 | 239,362 | |||
| Total | $ 422,804 | $ 909,615 | $ (463,201) | $ 27,932 | $ 897,150 |
As indicated in Staff Report #2, dated June 26, 2019, the ten year trend experienced growth in ridership in the affected categories prior to the introduction of any new subsidized fare programs. The table above has not taken into account the revenue growth associated with the ridership growth that would have been expected to occur in these categories based on historic trends.
As set out in the Commission’s Fare Strategy, it is beyond the mandate and expertise of London Transit to effectively resolve broader social and community issues related to income distribution, and as such, any programs of this nature that are put in place, are done so via subsidy program. These subsidy programs are undertaken on the basis that their costs are not a public transit cost per se, but rather a cost associated with supporting a defined group’s use of public transit.
Given this arrangement, the subsidy provided by the City of London for these programs, is considered fare revenue from London Transit’s perspective. Generally the program subsidies are designed to provide London Transit with the difference between what fare would have been collected prior to the subsidy being in place, and that collected with the subsidy. This approach not only ensures that the cost benefits of each of the subsidy programs can be measured, it also ensures that the costs associated with the provision of these programs is not considered a cost of providing public transit.
All of the subsidy programs currently in place are limited with respect to those able to participate, and two of the three are the direct result of recommendations from the London For All – A Roadmap to End Poverty Report. These two programs (Income-Related Pass and Free Transit for 12 and Under) were established to address concerns relating to poverty and related access to transportation in the community, with any potential for ridership growth on transit being a secondary benefit. As such, the subsidies for these two programs cover the full difference between the subsidy and the previous fare.
The Youth Pass was the third subsidy program to be approved by Municipal Council, and while this wasn’t a direct recommendation from the London For All – A Roadmap to End Poverty Report, the requests leading to this program were largely centered on the ability of youth in London to pay the full price of a Citipass. Given the London Transit Fare Structure already recognized youth with the availability of a discounted Student ticket category, the subsidy for this program is modelled on a cost-share basis.
The following chart provides the total subsidy for each of the reduced fare programs being assessed.
Reduced Transit Fare Subsidies – 2018
| Program | City of London | London Transit | Total |
| Free Transit for 12 and Under | $422,804 | $422,804 | |
| Income-Related Transit Pass | 413,511 | 413,511 | |
| Youth Pass | 63,757 | $34,175 | 97,932 |
| Total | $900,072 | $34,175 | $934,247 |
The conventional transit operating budget relies on four sources of revenue to offset the annual operating costs, the make-up of same for 2018 is set out in the table below.
2018 Conventional Operating Budget
Sources of Revenue
| Revenue from Fares | 46 % |
| Operating & Reserves | 4 % |
| Provincial Gas Tax | 13 % |
| City of London | 37 % |
The subsidies collected from the City of London in 2018 for the three subsidized fare programs totaling $900,072 is included in the revenue from fares percentage above. The portion of the subsidy underwritten by London Transit for the Youth Pass is considered an expenditure. The above ratios are important to understand when assessing subsidy programs.
Provincial Gas Tax guidelines for usage are such that it cannot be used to offset a fare for a specific group or demographic, it can however be utilized to offset fare increases that would affect transit ridership at large. The higher than historic percentage of Provincial Gas Tax utilized in 2018 is reflective of the Commission’s decision to defer two planned fare increases over the past four years, and alternatively rely on Provincial Gas Tax to offset the shortfall. This approach is also reflected in the lower than historic percentage of 46% in 2018 that is sourced from the fare box.
If London Transit were to implement the aforementioned reduced fare programs, without a subsidy in place, an additional $900,072 in revenue would need to be sourced in order to arrive at a balanced budget. Given the restrictive guidelines for use of Provincial Gas Tax, coupled with the limited ability to increase operating funding (e.g. advertising, interest income), the only options available to fund these programs would be to increase other fares, increase the level of funding provided by the City of London or a combination of both. Increasing fares places the burden associated with a discount for a specific group on the existing transit ridership, and has the potential to result in a loss of ridership, which can further compound the revenue problem. Seeking the additional funding from the City of London ultimately looks to the same funding source, however disguises the costs associated with the provision fares intended to address social issues by including same in the overall cost of transit.
A report will be provided to Municipal Council with respect to each of the reduced fare programs, noting each was approved as a pilot and will be subject to consideration during the next multi-year budget deliberation.
Overall Revenue Trends in 2018
The following table provides a breakdown of the revenue detail for each fare category discussed earlier in this report for 2017 and 2018. Further discussion on the changes in each of the major categories follows.
London Transit Revenue Comparison – 2018 vs 2017
| Revenue | 2017 | 2018 | Variance | % Variance |
| Cash | ||||
| Adult | $ 3,671,615 | $ 3,508,159 | $ (163,456) | (4.5)% |
| Tickets | ||||
| Adult | 7,159,595 | 7,804,738 | 645,143 | 9.0% |
| Student | 1,455,038 | 1,399,534 | (55,504) | (3.8)% |
| Senior | 845,698 | (845,698) | ||
| Child | 153,956 | 422,802 | 268,846 | 174.6% |
| 9,614,287 | 9,627,074 | 12,787 | 0.1% | |
| Passes | ||||
| Citipass | 4,769,459 | 4,476,373 | (293,086) | (6.1)% |
| Weekday Pass | 906,120 | 932,623 | 26,503 | 2.9% |
| Post-Secondary | 101,850 | 95,690 | (6,160) | (6.0)% |
| Seniors | 571,621 | (571,621) | ||
| Summer | 42,122 | 37,500 | (4,622) | (11.0)% |
| Blind | 136,438 | 133,729 | (2,709) | (2.0)% |
| Other | 76,762 | 142,844 | 66,082 | 86.1% |
| Income Based | 1,095,024 | 1,095,024 | ||
| Youth | 239,362 | 239,362 | ||
| 6,604,372 | 7,153,145 | 548,773 | 8.3% | |
| Tuition | ||||
| Western Undergrad | 6,614,763 | 6,885,280 | 270,517 | 4.1% |
| Western SOGS | 1,088,626 | 1,172,057 | 83,431 | 7.7% |
| Fanshawe | 3,706,891 | 4,151,728 | 444,837 | 12.0% |
| 11,410,280 | 12,209,065 | 798,785 | 7.0% | |
| Total | $ 31,300,554 | $ 32,497,443 | $ 1,196,889 | 3.8% |
Cash ridership was down slightly in 2018 as compared to 2017, which has been the trend over the past ten years. None of the new fare programs implemented were determined to have any impacts on the cash fare category and as such, this decline is considered to be a continuation of the ongoing trend with respect to cash fares.
The ticket category was assessed to have been impacted by all of the new fare programs as discussed earlier in this report. Giving consideration to the prior ten year trends, it is believed that, without the introduction of the free fare for children 12 and under, the income-related pass, the youth pass and the elimination of the senior ticket and pass categories, there would have been no discernable change in the overall ticket category in 2018 as compared to 2017.
The pass category was also assessed to have been impacted by two of the new fare programs as discussed earlier in this report. Giving consideration to the prior trends in this category remaining relatively static as a percentage of total ridership, it is believed that the growth in the pass category is a combination of ridership growth stemming from the income-related and youth pass programs as well as growth in ridership generally.
Revenue in the tuition pass category is directly tied to enrollment at the participating institutions. In 2018, Fanshawe College opened a second campus in the core, and as such, enrollment numbers increased, resulting in significant increase in students utilizing their tuition pass and associated transit ridership.
Fare Program Going Forward
With the exception of the introduction of a number of programs assessed earlier in this report, there were no discernable changes to historic trends in fare distribution. As set out in Staff Report #4, dated June 26, 2019, there is an expectation that fare adjustments will be required in the next four year budget cycle. Given the current shortfall of revenue that is being funded via Provincial Gas Tax, it is likely the initial fare increase will be recommended to occur early in 2020.
In addition, as indicated earlier, the reduced fare programs that are currently in place and subsidized by the City of London are all subject to assessment and budget consideration going forward. Given the discounted nature of these programs (a % discount from the adult fare), all would be subject to change at the same time a fare increase is implemented.
April of 2019 also saw the re-introduction of the senior ticket, which is offered at $1.43 per trip versus the $1.90 adult ticket rate. This program is again being subsidized by Municipal Council, with the subsidy being the difference between the two fares.
Given the uncertainty of a number of fare programs, coupled with the significant amount of revenue targeted to be sourced from a fare increase, it is likely that all fare categories will be impacted. Avoiding across the board fare increases is always preferred when implementing change, however given there have been no fare increases since 2008, this approach is considered more palatable. Further, as set out in the table below, London Transit fares, as compared to its peer group, are at the low end of the scale in all categories.
Adult Fares in Effect as at June 1, 2019
| System | Cash | Ticket | Pass |
| Barrie | $ 3.00 | $ 2.60 | $ 86.00 |
| Brampton | 4.00 | 3.10 | 128.00 |
| Burlington | 3.50 | 2.75 | 100.00 |
| Durham | 3.75 | 3.20 | 117.00 |
| Guelph | 3.00 | 2.80 | 80.00 |
| Hamilton | 3.00 | 2.30 | 101.20 |
| Kingston | 3.00 | 2.00 | 76.00 |
| London | 2.75 | 1.90 | 81.00 |
| Mississauga | 3.75 | 3.20 | 135.00 |
| Oakville | 4.00 | 3.10 | 129.00 |
| St. Catharines | 3.00 | 2.60 | 92.00 |
| Sudbury | 3.40 | 2.70 | 93.00 |
| Thunder Bay | 2.75 | 2.48 | 77.00 |
| Waterloo | 3.25 | 2.76 | 86.00 |
| Windsor | 3.00 | 2.53 | 95.70 |
| York Region | 4.00 | 3.75 | 150.00 |
| Average | $ 3.32 | $ 2.74 | $ 101.68 |
| London ranking | lowest | lowest | 4th lowest |
In addition to increases in the existing fare categories, consideration will be given to the introduction/ removal of fare categories or options, including but not limited to:
- a one/multi day pass and/or family pass
- a 31 day pass (rolling 31 days versus calendar month)
- park and ride and/or event passes
- employer sponsored passes
- universal pass programs for other organizations
- adjustment to the 90 minute transfer
- student summer pass and post-secondary monthly pass
- tuition pass program parameters
As set out in the report recommendation, the objectives and principles of the Fare Strategy will be applied in the development of the recommended fare increase(s). Until such time as the multi-year budget, which will be tabled with the Commission at the August 2019 meeting, is approved, the details with respect to fare increases cannot be finalized.
Recommended by:
Mike Gregor, Director of Finance
Concurred in by:
Kelly S. Paleczny, General Manager