Staff Report #4
May 21, 2019
To All Members of the Accessible Public Transit Service Advisory Committee
Re: 2018 Annual Service Performance Report – Conventional Transit Service
Recommendation
That the report be NOTED and FILED.
Background
The 2015-2018 Business Plan, London Transit’s vision is: “The valued and trusted mobility choice for Londoners”. The vision is supported by the mission statement, “Moving Londoners – progressively, reliably and affordably”. The vision and mission statements give direction to five congruent and competing strategic outcomes, namely:
- An integrated, affordable and valued mobility choice
- An engaged, diverse and respectful workplace
- Demonstrated fiscal accountability
- Being open, transparent and understood
- Effective utilization of infrastructure
Service performance is measured in terms of fiscal accountability (efficiency), service (effectiveness and quality), and communication (accuracy and quality of information provided).
Conventional Transit Service – Efficiency
The following table provides a summary of ridership and revenue service hours actual to budget performance for 2018. Actual ridership and service provided, as well as the related measures were consistent with budget expectations.
2018 Ridership and Service Hours – Actual versus Budget
| Description | Actual | Budget | Amount Better (Worse) | Percent Better (Worse) |
| Revenue service hours (millions) | 0.635 | 0.643 | -0.008 | -1.2% |
| Ridership (millions) | 23.746 | 23.557 | 0.189 | 0.8% |
| Rides per capita | 60.7 | 60.7 | 0.0 | —% |
| Rides per revenue service hour | 37.4 | 36.6 | 0.2 | 0.5% |
| Service hours per capita | 1.7 | 1.7 | 0.0 | —% |
The following table provides comparisons in the various ridership and service hour measures over the past four years.
Ridership and Service Hour Comparisons – 2015 through 2018
| Description | 2015 | 2016 | 2017 | 2018 | % Change Over Period |
| Revenue service hours (millions) | 0.581 | 0.603 | 0.614 | 0.635 | 9.3% |
| Ridership (millions) | 22.369 | 22.564 | 22.918 | 23.746 | 6.2% |
| Rides per capita | 58.7 | 59.2 | 60.1 | 60.7 | 3.4% |
| Rides per revenue service hour | 38.5 | 38.5 | 37.3 | 37.4 | -2.9% |
| Service hours per capita | 1.5 | 1.6 | 1.6 | 1.6 | 6.7% |
As indicated in the table above, there have been improvements in all measures over the four year period 2015 through 2018, much of which is the result of the implementation of the service improvements in each of the years as part of the 5 Year Service Plan.
The construction season of 2018 ran from early April through December, and was one of the most extensive, in terms of impacts to LTC services in many years. During the majority of the construction season, LTC had 13 routes operating on detour and another 20 routes that were navigating through construction zones, all of which had a significant impact on the on-time reliability of the service. In addition, the extent of some of the construction projects resulted in the need to close bus stops, which resulted in transit riders having to walk further to get to the nearest stop. Communication efforts during this period were significantly enhanced, with a focus on providing up-to-date information on service delays and detours as well as stop-level notifications along affected routes. The introduction of time-stamped tweets, which provide up-to-date service information at key times during the morning and afternoon peak periods was well-received by LTC followers. LTC administration attended regular meetings with civic administration and construction contractors to ensure the most up-to-date information could be shared with transit customers. As set out in the Commission Staff Report #13 – Impact of 2019 Road Construction – Conventional Transit Service, dated March 27, 2019, this approach will be followed again in 2019 as the construction season is set to result in disruptions to a number of routes and transit services in general.
Voice of the Customer
As indicated in Staff Report #3 – Voice of the Customer – 2018 Survey, dated May 21, 2019, the 2018 Voice of the Customer surveys, which are normally conducted in late November each year, were delayed until January 2019 due to scheduling conflicts with the contractor, however are still considered a reflection of 2018. Survey feedback with respect to various aspects of LTC service will be included in the following narrative along with actual statistics for the calendar year of 2018. Of note, the 2018 survey included a number of new/revised questions that have been adopted by a number of transit systems in order to provide for the ability of peer comparisons. Given time limitations for completing the survey, the addition of new questions required some traditional questions used in previous LTC surveys to be removed. Specific commentary with respect to instances where this occurred will be discussed later in this report.
Impressions of London Transit Service
This area of the Voice of the Customer survey measures satisfaction levels with LTC service including measures ranging from the convenience of the service to the cost of the service. The table below sets out the percent of survey respondents that agreed or strongly agreed with statements regarding the service for the three years of the survey.
Voice of the Customer Perceptions – 2018 Survey
| Service Statement | 2016 | 2017 | 2018 |
| Bus routes are conveniently located | 81% | 79% | 77% |
| There is enough seating on the bus | 63% | 63% | 64% |
| There is adequate weekday service | 80% | 78% | |
| There is adequate Saturday service | 53% | 53% | |
| There is adequate Sunday service | 27% | 31% | |
| The service operates at the times I need | 68% | ||
| The service operates on the days that I need it | 83% |
Satisfaction levels relating to the convenience of the service and availability of seating on buses has remained relatively consistent over the three waves of the survey. In 2018, questions with respect to service availability were modified to be consistent with those asked of other transit agencies, and as such, there are no direct LTC comparators for previous years. The lower rating for the satisfaction level with the times the service operates is indicative of long-standing requests for extensions to the service day, both to start earlier and end later. The recently approved 5 Year Service Plan Framework looks to extend the service day to start at 7 am on Sunday and extend until 1 am Monday through Saturday on the remainder of the system, as was introduced on 11 routes in 2018 and 2019 Service Plans respectively.
Another area of London Transit’s service measured by the Voice of the Customer surveys covers service performance expectations. The table below sets out the percent of survey respondents that agreed or strongly agreed with statements regarding service delivery.
Voice of the Customer Perceptions
| Service Statement | 2016 | 2017 | 2018 |
| Bus gets me to destination in reasonable time | 74% | 78% | 76% |
| Bus runs on time | 59% | 52% | 49% |
Both the Voice of the Customer survey and customer contacts are reflective of a customer’s perception of the service, based on their experience. As set out in Staff Report #3 Voice of the Customer – 2018 Survey, dated May 21, 2019, the actual on-time performance for December 2018 (immediately prior to the period when the survey was conducted) averaged 71%, which, while not considered satisfactory, is significantly better than the perception of 49%.
In addition to the Voice of the Customer surveys, customer satisfaction levels with service performance are measured through tracking both the number and nature of customer contacts received via email, social media, and phone. When considering these numbers, it is important to recognize that not all contacts are investigated and as such, have not been confirmed as an accurate characterization of the event. Contacts that are serious in nature or those in which the customer requests a response are all investigated.
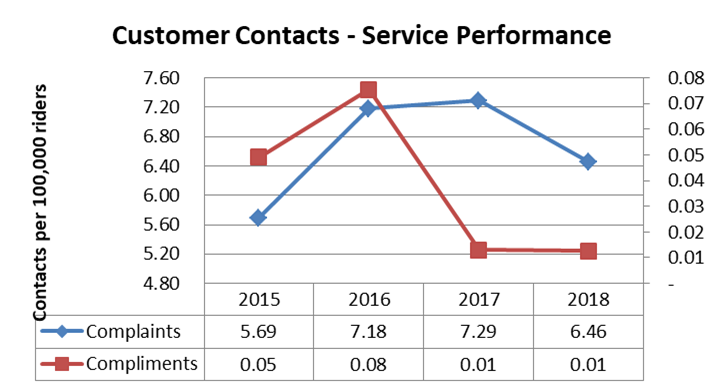
As set out in the following chart, service performance complaints expressed in terms of 100,000 riders has been trending upward since 2015. In 2018, the trend reversed, taking this measure back below that of 2016. This overall decline is somewhat surprising given the significant impacts that construction had on the service reliability and convenience for a significant portion of 2018, however could be reflective of the increased communication efforts established in 2018 intended to provide customers with real-time service information as well as up-to-date detour information via Twitter and the LTC website.
The charts below provide an overview of the total number of complaints and compliments as well as a breakdown of same by category which provides the opportunity for further analysis.
As important as the overall number of complaints received, is the nature of the complaints, all of which are analyzed to assess the impacts of past years’ service plan changes as well as to plan for future service changes. The table below sets out a breakdown of the number of service complaints over the four year period by category, as well as a percentage change in each category over the period.
Total Service Performance Complaints by Category 2015-2018
| Complaints – Service | 2015 | 2016 | 2017 | 2018 | % Change |
| Detour/off route | 46 | 122 | 141 | 115 | 150% |
| Early schedule | 182 | 223 | 237 | 106 | -42% |
| Late schedule | 398 | 460 | 515 | 521 | 31% |
| Missed passenger – drove by | 317 | 313 | 303 | 324 | 2% |
| Missed passenger – not at stop | 217 | 375 | 374 | 375 | 73% |
| Overcrowding | 65 | 78 | 60 | 58 | -11% |
| Transfer connection | 48 | 49 | 40 | 34 | -29% |
| Total | 1,273 | 1,620 | 1,670 | 1,533 | 20% |
| Per 100,000 riders | 5.69 | 7.18 | 7.29 | 6.46 | 13% |
The top category of complaints over the four year period has remained “late schedule”. While significant resources were applied to service changes over this period to address a service that was operating at or exceeding capacity, the number has remained relatively consistent. The customer’s level of frustration with service reliability is echoed in the Voice of the Customer results, noting that the perception of the bus running on time has dropped from 59% in the 2016 survey to 49% in the 2018 survey. As indicated earlier in this report, the service disruptions resulting from the lengthy and expansive construction projects in 2018 are thought to have had significant influence on this measure. Given the extensive impacts the 2019 construction season is anticipated to have on transit services, a communications campaign will be launched in the coming weeks forewarning customers of the potential for service delays and to plan accordingly.
The second highest category over the period is “missed passenger”, either “drove by” or “not at stop”. “Missed passenger drive by” and “missed passenger not at stop” are differentiated by the customer providing information as to whether or not they were at the physical stop at the time of the bus passing. Given the continued high number of complaints relating to missed passenger-not at stop, a key topic for a customer education in 2019 is to include commentary in on-board communications referencing the requirement for Operators to, for safety purposes, continue in motion once they have begun to pull away from a stop.
The decline in the number of “detour – off route” complaints in 2018, notwithstanding the significant detours and service interruptions experienced throughout the year is indicative that increased efforts at communicating up-to-date information to customers through all available means was effective.
The significant decline in “early schedule” complaints is indicative of the focus applied to this issue by the Operations department in 2018 as part of a review of service reliability. Service monitoring, including the review of AVL data, riding routes that have a higher rate of schedule adherence issues and discussions with Operators driving those routes, led to information that was shared with the Planning department to make adjustments to schedules where possible, that result in better schedule adherence.
The other factor that can impact service delivery is service interruptions stemming from vehicle breakdowns. The table below sets out the mean kilometers between service interruptions, further broken down between those requiring the bus to be changed off and returned to the garage and those that could be fixed on-route by the mobile mechanic. While both categories represent an inconvenience to customers and an interruption to service, those that can be addressed by the mobile mechanic on-route cause less of a disruption.
Mean KMs Between Service Interruptions – 2015-2018
| Description | 2015 | 2016 | 2017 | 2018 |
| Service pull-ins | 2,513 | 2,434 | 2,323 | 2,406 |
| Mean kms between pull ins | 4,578 | 5,027 | 5,403 | 5,359 |
| Year over year change | 10% | 7% | -1% | |
| In-service repairs (mobile mechanic) | 2,416 | 2,562 | 2,854 | 3,053 |
| Mean kms between in-service repairs | 4,381 | 4,776 | 4,398 | 4,223 |
| Year over year change | 9% | -8% | -4% |
In-service repairs (road service calls) and service pull-ins have a negative impact on the quality of customer service e.g. schedule adherence. Such events are inherent in public transit operations given such factors as weather and road conditions, the constant start/stop nature of the operation and the increased complexity and sensitivity associated with bus systems and related ancillary equipment (e.g. Automatic Vehicle Location (AVL), electronic fare boxes, smart card equipment, etc.).
Service pull-ins, measured in terms of mean revenue kilometers between incidents declined slightly in 2018 as compared to 2017; however remained above the numbers in 2015 and 2016. This category is the most disruptive of the two, as it requires customers to vacate the bus and transfer to a replacement bus. As such, efforts are made to identify the issues resulting in these instances, and equipping the mobile mechanic, where possible, to rectify these issues on road. This strategy is reflected in the increased number of in-service repairs over the period. In addition, in late 2018, a pilot program was launched to allocate a mobile mechanic to the weekends in an effort to reduce the need for service pull-ins.
Impressions of Operator Performance
Another area of London Transit’s service measured by the Voice of the Customer surveys covers Operator performance expectations. As set out in the table below, survey respondents indicated a continued high level of satisfaction with Operator performance. In 2018, an additional question was added to the survey consistent with surveys of other peer transit systems. As the table indicates, customers indicated their high level of confidence in LTC Operator’s knowledge of the system.
Voice of the Customer Perceptions
| Service Statement | 2016 | 2017 | 2018 |
| The bus is well driven | 80% | 87% | 89% |
| Bus drivers are helpful and courteous | 79% | 79% | 79% |
| Bus drivers are knowledgeable about transit system | 86% |
Consistent with service related contacts, customer contacts (complaints and compliments) regarding Operator performance are also tracked and trended. Performance results for 2015 through 2018 with respect to Operator complaints are set out in the following table. When comparing the number of complaints from previous years, either in total or by category, it is important to remember that ridership and service levels have also increased. The total complaints per 100,000 kilometers provide a normalized indication of the level of escalation in complaints year over year.
Total Operator Complaints by Category 2015-2018
| Complaints – Operator Performance | 2015 | 2016 | 2017 | 2018 | % Change |
| Speeding | 33 | 38 | 46 | 42 | 27% |
| Unsafe manner | 390 | 428 | 327 | 445 | 14% |
| Deadheaded | 13 | 28 | 20 | 21 | 62% |
| Idling | 0 | 8 | 8 | 6 | –% |
| Drive through red light | 30 | 22 | 35 | 27 | -10% |
| Not stopping at stop sign | 11 | 9 | 7 | 17 | 55% |
| Yield to Bus | 51 | 53 | 45 | 46 | -10% |
| Quality of Ride | 36 | 54 | 66 | 53 | 47% |
| Splashed Pedestrian | 5 | 9 | 5 | 10 | 100% |
| Driving | 569 | 649 | 559 | 667 | 17% |
| Attitude/Treatment | 788 | 674 | 603 | 607 | -23% |
| Presentation | 0 | 15 | 7 | 59 | –% |
| Smoking | 14 | 11 | 14 | 16 | 14% |
| Cell Phone | 40 | 28 | 44 | 27 | -33% |
| Missed stop requested | 6 | 59 | 38 | 55 | 817% |
| Service received | 848 | 787 | 706 | 764 | -10% |
| Total | 1,417 | 1,436 | 1,265 | 1,431 | 1% |
| Per 100,000 kilometres | 12.3 | 11.7 | 10.1 | 11.1 | -10% |
As indicated in the table, in total, complaints in 2018 increased slightly over 2017, back to levels consistent with 2016; however, over the period, the number of complaints per 100,000 kilometers travelled has decreased by 10%.
Driving related Operator complaints increased to the highest level over the four year period in 2018, with the highest number of complaints relating to “unsafe manner”. The increase in “unsafe manner” complaints in 2018 can be largely attributed to complaints received about buses travelling on detour (as the result of numerous construction projects) on streets that typically don’t see bus traffic. The types of complaints received in this area include speed, braking, merging, and turning, all of which the complainant has perceived were conducted in an unsafe manner. The size of a standard bus, coupled with the noise at acceleration being louder than a typical vehicle, often lead to the assumption that the bus is speeding, however, in the majority of the complaints of this nature that have been investigated, it is found that the bus is travelling well within posted speed limits.
As the table indicates, driving complaints, which account for approximately 47% of the complaints regarding Operator performance decreased by 10% over the period. Complaints relating to driving are taken seriously, with particular attention paid to those categories which could result in a motor vehicle accident or injury to passengers (speeding, driving in unsafe manner, drive through red light, not stopping at stop sign). 2018 saw a continued focus on defensive driver training, and management follow-up on driving complaints, specifically complaints related to unsafe behavior. This will continue in 2019, including the practice of scheduling Operators with a high number of driving-related complaints for accelerated defensive driving refresher training.
Total complaints with respect to ‘service received from the Operator’ decreased by 10% over the period, to the second lowest total in the four year horizon. The largest number of complaints in this category (representing approximately 79% of the total) relate to driver attitude and passenger treatment (good, poor etc.), which remained consistent with 2017 levels, lower than the earlier year trends. Complaints are up slightly in the remaining categories, however it should be noted that while the percentage increases appear to be significant, they are only high given the relatively small number of complaints in each of the categories.
In 2015, a comprehensive Advanced Customer Service Program was introduced, and rolled out to all current Operators as part of the Operator Education Program, which was developed for experienced operators. As of the end of 2018, all experienced Operators had been trained in the new program. In 2019, the program will be rolled out Operators with less than three years’ experience, and additionally will be included in the New Operator Training Program going forward. The program was developed specifically to address current customer service trends, and provides additional guidance and support to Operators on how best to effectively manage issues such as schedule adherence and overcrowding, emphasizing appropriate driver behaviour, and re-iterating professional customer service expectations, with the goal to provide better service and ultimately reduce customer service complaints.
In the case of complaints alleging a significant Operator performance issue, an investigation is completed, which can include any or all of the following; interview with the Operator and complainant, assessment of AVLC data, review of the bus’ audio/visual system (noting there is a strict protocol for accessing the system recordings). It should be noted that contacts received from customers are based on the customer’s perception of the incident, and are not always consistent with what actually occurred. In all situations, when requested, a response regarding the assessment is provided to the customer who filed the contact.
Operator performance compliments are also tracked and trended, and while down very slightly in 2018 as compared to 2017, remain relatively consistent with the four year average. The chart below sets out the trend in Operator compliments over the period of 2015 through 2018.
Total Operator Compliments by Category 2015-2018
| Compliments – Operator Performance | 2015 | 2016 | 2017 | 2018 | % Change |
| Attitude/Treatment | 341 | 272 | 267 | 249 | -27% |
| Presentation | 9 | 1 | 3 | 9 | 0% |
| Service received | 350 | 273 | 270 | 258 | -26% |
| Per 100,000 riders | 1.56 | 1.21 | 1.18 | 1.09 | -31% |
Impressions of Service Safety
As set out earlier in this report, 89% of respondents feel that LTC vehicles are operated in a safe manner, up from 87% in the previous survey.
Accident/incident reports in 2018 increased significantly and reversed the previous three year trend of decline. The tables below set out the total number of reports for each year for the period of 2015 through 2018.
Summary of Motor Vehicle Accidents – On Road 2015-2018
| Description | 2015 | 2016 | 2017 | 2018 |
| Number of reports | 329 | 302 | 291 | 359 |
| Preventable | 160 | 130 | 136 | 175 |
| Non-Preventable | 168 | 172 | 155 | 184 |
| Total per million km | 28.5 | 24.6 | 24.4 | 27.9 |
| Per 100,000 service hours | 56.6 | 50.1 | 47.4 | 56.5 |
| Mean km between reports | 34,971 | 40,514 | 42,046 | 35,853 |
| Year over year percent change | 16% | 4% | -15% |
Preventable motor vehicle accidents (MVAs) increased by approximately 30% over the previous year. The major categories for preventable MVAs continue to be striking fixed objects (lamp posts, parked cars, etc.) and sideswipes. As with customer contacts, the increases in service hours year over year need to be taken into account when assessing trends with motor vehicle accidents. When looking at the total motor vehicle accidents per million kilometers travelled and per 100,000 service hours, both increased slightly in 2018. In 2018 an assessment was undertaken to evaluate the effectiveness of the current Defensive Driving and Refresher Program (DDC) for both new and current Operators. The findings demonstrated that Operators with less than two years’ service were responsible for the highest percentage of striking fixed objects and that further training in this area was required. As such in 2019, the DDC program was enhanced to provide increased focus/dedicated time on ensuring proper clearance. This is an area that will be monitored closely in 2019, to ensure the enhanced training has the desired impact. In addition, education campaigns regarding safe driving practices relating to the most common accident types continue to run on LTC communication boards in an effort to curb this trend.
In 2018, accidents/incidents assessed as preventable represented approximately 49% of the reports filed rising to the highest levels in the four year period. The determination of preventable vs. non-preventable is based upon the Ontario Safety League protocol.
Summary of Passenger Falls – 2015-2018
| Description | 2015 | 2016 | 2017 | 2018 |
| In motion | 24 | 46 | 28 | 23 |
| Stationary | 21 | 5 | 13 | 17 |
| Total | 45 | 51 | 41 | 40 |
| Per million km | 3.9 | 4.2 | 3.4 | 3.1 |
| Year over year percent change | 7% | -17% | -10% |
Passenger falls decreased very slightly over 2017 and reached the lowest total in the four year period.
The nature and extent of accidents/incidents are reflective of a number of factors including:
- changing and severity of weather conditions;
- increased road congestion and issues of road condition; and
- heightened service and customer service expectations.
All passenger fall reports are reviewed, including, as warranted, accessing audio/visual system recordings to investigate the event, all of which is shared with the Commission’s adjuster and legal counsel. The management of accidents/incidents is critical to providing passengers with a safe trip as well as mitigating risk and liability. In terms of cost and risk, the vast majority of the reported accidents/incidents are minor in nature reflecting in part the broad definition of what constitutes an accident/incident. The management program includes remedial training as appropriate, and the ongoing refresher defensive driving program which calls for each Operator to complete the program once every three years.
Access to LTC Information
The Voice of the Customer survey asked respondents to rate their level of satisfaction with availability of information with respect to schedule adherence and service information, the results of which are set out below.
Voice of the Customer Perceptions – Availability of LTC Information
| Service Statement | 2016 | 2017 | 2018 |
| It is easy to find out if buses are running on schedule | 57% | 66% | 67% |
| It is easy to get information about LTC services/schedules | 74% | 78% | 76% |
A number of initiatives were undertaken in 2018 that were expected to increase customer satisfaction in these two areas, including the upgrade of the Automatic Vehicle Location System which included a new InfoWeb real-time bus arrival system and direct email alerts to customers that are route/stop specific. In addition, the corporate Twitter account was launched and began providing time-stamped tweets relaying real-time service information. In late 2018, a feed of the LTC real-time information was released, which allowed for Google Maps to display real-time LTC bus information in its trip planning tool. In addition, a number of application developers are utilizing the real time feed to provide real-time LTC information in their respective applications. Notwithstanding the number of initiatives launched in 2018 to improve communications with respect to service and schedules, the perceptions of customers from the survey remain consistent with previous years.
The 2018 Voice of the Customer survey added questions with respect to the new ways in which to obtain real-time information and whether customers had signed up to use them, responses to which are set out in the table below.
Voice of the Customer – Real-Time Information Usage
| Usage Statement | 2018 |
| I follow the LTC corporate Twitter account | 9% |
| I signed up for real-time alerts | 23% |
While the followers on the Corporate Twitter account have grown to approximately 1,470 followers, and 23% of respondents have signed up for real-time email alerts, promotion of these options for receiving real-time information will continue to be a priority for 2019.
The other manner in which customers interface with LTC is via the customer service representatives, either via email, telephone or Twitter. As set out in the following table, satisfaction levels with respect to customer service received by survey respondents was generally positive, but with room for improvement.
Voice of the Customer Perceptions – LTC Customer Service
| Service Statement | 2016 | 2017 | 2018 |
| Customer service reps are helpful & courteous | 70% | 75% | 82% |
| My calls are answered promptly | 60% | 73% | 72% |
| My issues are addressed in a timely manner | 61% | 63% | 66% |
As the table indicates, the level of satisfaction with the customer service representatives significantly improved over previous years, while the promptness of calls being answered and responded to both remained relatively consistent. It should be noted that following the 2017 Voice of the Customer survey, LTC established a standard for responding to customer contacts (email, telephone, in person) to be within 10 working days notwithstanding acknowledgment of receipt (where the customer is advised of same) and that if the timeline will not be met, the customer is contacted and advised of the extension. In addition, in the vast majority of contacts, a response within one day is expected when contacts are general in nature. 2018 saw a performance rate of meeting this target 84% of the time. Continued efforts to improve the response time as well as a public information campaign to be a focus in 2019.
In addition to a website update which included a new mechanism for tracking visits, 2018 also saw the replacement of the telephone system, which also included a new mechanism for tracking calls. Given the introduction of the new tracking systems, which both function differently than those utilized in the past, previous year numbers are not provided as they are not considered comparative. The following table provides a breakdown of the various methods of Customer access based on the new tracking systems.
Summary of Customer Access – LTC Information
| Description | 2018 |
| Calls/Visits (millions) | |
| Information line – answered calls (1) | 0.089 |
| Interactive voice response (2) | 0.236 |
| Website – main site visits (3) | 1.690 |
| Website – InfoWeb real-time (3) | 0.061 |
| 2.076 | |
| Total rides (millions) | 23.746 |
| Calls/visits per million rides | 0.087 |
| Percent Make Up | |
| Information line – answered calls | 4.3% |
| Interactive voice response | 11.4% |
| Website – main site visits | 81.4% |
| Website – InfoWeb real-time | 2.9% |
| Total | 100.0% |
- Information Line statistics are for the hours of 6a.m. – 10p.m. Monday through Friday and 8:30a.m. – 4:30p.m. on weekends and statutory holidays. Service information provided by staff is based upon real-time information. Staff also assists with trip planning.
- Interactive Voice Response (IVR) – IVR is a phone system that utilizes voice recognition technology to assist customers with providing real-time information by stop for conventional transit.
- The numbers included in these items are based on Google Analytics, which measures sessions vs visits, which results in a much smaller number than previously reported. A session is defined as the amount of time a user is actively engaged with the site, and all usage within that engagement is measured as one session.
The use of IVR and the LTC website continue to represent the majority of customer interactions with London Transit. Google Transit trip planning and real-time information are also widely utilized; however Google does not share visitor statistics with participating transit properties, so these numbers are not included in the above table. In addition to the above access points, the LTC currently provides approximately 500,000 printed route schedules (noting the schedules are also available for printing or downloading from LTC’s website), 50,000 printed ride guides.
Going Forward
As set out in Staff Report #6 – 2019-2022 Business Plan, dated May 21, 2019, one of the key initiatives for the 2019-2022 Business Plan is to enhance the marketing and promotion of LTC with an emphasis on the value it brings to the community. This is likely to include shelter posters and on-board communications and may also be extended to include external advertising on the fleet (subject to the availability of advertising space).
Another initiative included in the 2019-2022 Business Plan report is the assessment of other methods of interacting with and getting feedback from both existing and potential customers as well as other stakeholders. The drop-in sessions relating to the annual service plan tend to attract the same group of people; as such 2018 sessions were expanded to on-street conversations at key bus stops. Feedback from staff indicates that the feedback received on the street was very useful, and also more specific than that received at the drop in sessions, which was beneficial to the planning process. Plans for 2019 include the assessment of opportunities to increase the opportunity for interactions with the public.
The introduction of the new Supervisory position in the Operations area in 2018 has also resulted in an increased ability to receive feedback from LTC Operators with respect to how the service is performing and how it can be improved upon. Feedback of this nature will continue to be a focus for this position going forward.
Recommended by:
Tyson Cragg, Manager of Operations Administration
Caroline Roy, Manager of Corporate Communications
Patrick Cormier, Manager of Information Systems
Shawn Wilson, Director of Operations
Craig Morneau, Director of Fleet & Facilities
Concurred in by:
Kelly S. Paleczny, General Manager