To All Commissioners
Re: 2017 Annual Service Performance Report – Conventional Transit Service
Recommendation
That the report be NOTED and FILED.
Background
The 2015-2018 Business Plan, London Transit’s vision is: “The valued and trusted mobility choice for Londoners”. The vision is supported by the mission statement, “Moving Londoners – progressively, reliably and affordably”. The vision and mission statements give direction to five congruent and competing strategic outcomes, namely:
- An integrated, affordable and valued mobility choice
- An engaged, diverse and respectful workplace
- Demonstrated fiscal accountability
- Being open, transparent and understood
- Effective utilization of infrastructure
Service performance is measured in terms of fiscal accountability (efficiency), service (effectiveness and quality), and communication (accuracy and quality of information provided).
Conventional Transit Service – Efficiency
The following table provides a summary of ridership and revenue service hours actual to budget performance for 2017. Actual ridership and service provided, as well as the related measures were consistent with budget expectations.
2017 Ridership and Service Hours – Actual versus Budget
| Amount | Percent | |||
| Better | Better | |||
| Description | Actual | Budget | (Worse) | (Worse) |
| Revenue service hours (millions) | 0.6142 | 0.621 | -0.01 | -1.1% |
| Ridership (millions) | 22.918 | 23.050 | -0.13 | -0.6% |
| Rides per capita | 60.1 | 60.5 | -0.35 | -0.6% |
| Rides per revenue service hour | 37.3 | 37.1 | 0.2 | 0.5% |
| Service hours per capita | 1.6 | 1.6 | 0.00 | —% |
The following table provides comparisons in the various ridership and service hour measures over the past four years.
Ridership and Service Hour Comparisons – 2014 through 2017
| % Change | |||||
| Over | |||||
| Description | 2014 | 2015 | 2016 | 2017 | Period |
| Revenue service hours (millions) | 0.571 | 0.581 | 0.603 | 0.614 | 7.6% |
| Ridership (millions) | 23.813 | 22.369 | 22.564 | 22.918 | -3.8% |
| Rides per capita | 63.1 | 58.7 | 59.2 | 60.1 | -4.7% |
| Rides per revenue service hour | 41.7 | 38.5 | 38.5 | 37.3 | -10.6% |
| Service hours per capita | 1.5 | 1.5 | 1.6 | 1.6 | 6.7% |
As indicated in the table above, while all ridership related measures have declined since 2014, the negative ridership trend experienced in 2015 has reversed, with the related measures improving in 2016. In terms of service hours and related measures, the implementation of the 5 year service plan has seen an increase of 7.6% in service hours in comparison to 2014 levels. Given the majority of the new hours in the 2015 and 2016 service plans were directed at addressing service quality issues, there has been an expected downward trend in the rides per revenue service hour, meaning that service levels are now better matched to demand.
Voice of the Customer
As indicated in Staff Report #2, dated February 28, 2018, the 2017 Voice of the Customer surveys were completed in late November/early December 2017. Survey feedback with respect to various aspects of LTC service will be included in the following narrative along with actual statistics for the calendar year of 2017.
Impressions of London Transit Service
This area of the Voice of the Customer survey measured satisfaction levels with LTC service including measures ranging from the convenience of the service to the cost of the service. The table below sets out the percent of survey respondents that agreed or strongly agreed with statements regarding the service for the fall 2016 and fall 2017.
Voice of the Customer Perceptions – 2017 Survey
| Service Statement | 2016 | 2017 |
| Bus routes are conveniently located | 81% | 79% |
| There is enough seating on the bus | 63% | 63% |
| There is adequate weekday service | 80% | 78% |
| There is adequate Saturday service | 53% | 53% |
| There is adequate Sunday service | 27% | 31% |
All of the measures in this area were the primary areas of study when completing the Route Structure and Service Guideline Review which resulted in the 5 year service plan framework, adopted by the Commission in 2015. A common theme heard throughout customer consultations during this review was the need for enhanced weekend service, with the focus being on Sunday service. As indicated in the table, there were no significant variances between customer perceptions in the fall 2016 survey and the fall 2017 survey, notwithstanding the increased investment in service relating to the implementation of the 2017 Service Plan. In response to customer feedback, the 2018 Service Plan includes significant investment in Sunday service with a number of routes beginning service 2 hours earlier (7am vs. 9am) one year in advance of the plan set out in the 5 year framework.
The underlying intent of the 5 year service plan is to “right size” the service, resulting in routing and service frequencies that are better matched to demand. Another key theme during the Service Review consultation was overcrowding conditions on a number of routes. The decline of 10.6% in rides per revenue service hour since 2014 demonstrates that adjustments made over the 2015-2017 service plans in an effort to better match service levels with demand, are achieving their goal. While overcrowding remains an issue on some routes, it has declined system wide as evidenced by a 23% reduction in overcrowding complaints from 2016 to 2017, and a 49% reduction in same since 2014. Further analysis will be completed as part of the annual service planning process.
Another area of London Transit’s service measured by the Voice of the Customer surveys covered service performance expectations. The table below sets out the percent of survey respondents that agreed or strongly agreed with statements regarding service delivery.
Voice of the Customer Perceptions
| Service Statement | 2016 | 2017 |
| Bus gets me to destination in reasonable time | 74% | 78% |
| Bus runs on time | 59% | 52% |
In addition to the Voice of the Customer surveys, customer satisfaction levels with service performance can be measured through tracking both the number and nature of customer contacts. As set out in the following chart, service performance complaints expressed in terms of 100,000 riders has been trending upward since 2014. For 2017, there was another slight increase in service complaints to 7.3 per 100,000 riders, which is also above the four year average of 6.3 complaints per 100,000 riders. The continued high number of service complaints with respect to on time reliability was impacted in 2017 by the construction occurring in the downtown core. The project at Wellington and King significantly impacted routes 1, 3, 13, 26, and the 90 Express schedule adherences for a period of 3 weeks in September. Additionally there was a traffic signal rebuild project on Oxford between Adelaide and Highbury from mid-September to early November resulting in lane reductions causing substantial service delays on routes 4, 17, 91 Express, and 104.
Customer Contacts – Service Performance
As important as the overall number of complaints received, is the nature of the complaints, all of which are analyzed to assess the impacts of past year service plan changes as well as to plan for future service plans. The table below sets out a breakdown of the number of service complaints over the four year period by category, as well as a percentage change in each category over the period.
Total Service Performance Complaints by Category 2014-2017
| Complaints – Service | 2014 | 2015 | 2016 | 2017 | % Change |
| Detour/off route | 65 | 46 | 122 | 141 | 117% |
| Early schedule | 186 | 182 | 223 | 237 | 27% |
| Late schedule | 298 | 398 | 460 | 515 | 73% |
| Missed passenger – drove by | 340 | 317 | 313 | 303 | -11% |
| Missed passenger – not at stop | 185 | 217 | 375 | 374 | 102% |
| Overcrowding | 117 | 65 | 78 | 60 | -49% |
| Transfer connection | 47 | 48 | 49 | 40 | -15% |
| Total | 1,238 | 1,273 | 1,620 | 1,670 | 35% |
The top two categories of complaints from 2014 to 2015 had been “late schedule” and “missed passenger – drive by”, both of which were reflective of a service that is operating at/or exceeding capacity. As in 2016, 2017 saw “late schedule” and “missed passenger, not at stop” as the two largest categories of complaint. “Missed passenger drive by” and “missed passenger not at stop” are differentiated by the customer providing information as to whether or not they were at the physical stop at the time of the bus passing. Given the continued high number of complaints relating to missed passenger-not at stop, a key topic for a customer education campaign in 2018 will include details with respect to this issue, including reference to the requirement for Operators to, for safety purposes, continue in motion once they have begun to pull away from a stop.
Also of note was the significant increase in the number of “detour/off-route” complaints. Most of the “missed passenger” and “detour” complaints were received after the beginning of the fall service changes. Through investigation of the complaints, it was revealed that many of the “missed passenger” and “detour/off-route” complaints were a result of potential misinformation or confusion on the part of customers related to the service changes. Passengers may have believed that the bus was on the wrong route or that they were missed at their stop because they were relying on outdated schedules or were not aware that their routes had changed. Significant and/or repeated schedule adherence complaints are checked against the Automated Vehicle Location (AVL) system and are investigated by Operations management. In an effort to mitigate confusion around service changes, a “Customer Education Campaign” regarding service changes was undertaken which included radio ads, stop level information, community outreach, social media, on-board notices and website updates to inform the customer base of the changes. While this effort to educate the riders was effective, the magnitude of the service changes contributed to the confusion on the part of the rider.
The other factor that can impact service delivery is service interruptions stemming from vehicle breakdowns. The table below sets out the mean kilometers between service interruptions further broken down between those requiring the bus to be changed off and returned to the garage and those that could be fixed on route by the mobile mechanic. While both categories represent an inconvenience to customers and an interruption to service, those that can be addressed by the mobile mechanic on-route cause less of a disruption.
Mean KMs Between Service Interruptions – 2014-2017
| Description | 2014 | 2015 | 2016 | 2017 |
| Service pull-ins | 2,302 | 2,513 | 2,434 | 2,323 |
| Mean kms between pull ins | 4,611 | 4,578 | 5,027 | 5,403 |
| Year over year change | -1% | 10% | 7% | |
| In-service repairs (mobile mechanic) | 2,377 | 2,416 | 2,562 | 2,854 |
| Mean kms between in-service repairs | 4,466 | 4,381 | 4,776 | 4,398 |
| Year over year change | -2% | 9% | -8% |
In-service repairs (road service calls) and service pull-ins have a negative impact on the quality of customer service e.g. schedule adherence. Such events are inherent in public transit operations given such factors as weather and road conditions, the constant start/stop nature of the operation and the increased complexity and sensitivity associated with bus systems and related ancillary equipment (e.g. Automatic Vehicle Location (AVL), electronic fare boxes, smart card equipment, etc.).
Performance measured in terms of mean revenue kilometers between incidents improved in the service pull in category, which is the most disruptive as it requires customers to vacate the bus and wait for a replacement. The in-service repairs increased to the highest number in the four year period, although the mean kilometers between repairs remained at or equal to the lowest. As part of the performance monitoring and quarterly review process, the fleet and facilities department breaks both of these categories down to determine the cause of the incident (i.e. engine, battery, electrical, dirty bus, etc.), and implements/modifies programs to mitigate same going forward.
Impressions of Operator Performance
Another area of London Transit’s service measured by the Voice of the Customer surveys covered Operator performance expectations. As set out in the table below, survey respondents indicated a high level of satisfaction with Operator performance.
Voice of the Customer Perceptions
| Service Statement | 2016 | 2017 |
| The bus is well driven | 80% | 87% |
| Bus drivers are helpful and courteous | 79% | 79% |
Consistent with service related contacts, customer contacts (complaints and compliments) regarding Operator performance are also tracked and trended. Performance results for 2014 through 2017 with respect to Operator complaints are set out in the following table. When comparing the number of complaints from previous years, either in total or by category, it is important to remember that ridership and service hours have also increased. The total complaints per 100,000 riders provide a good indication of the level of escalation in complaints year over year. As indicated in the table, in total, complaints in 2017 have declined significantly, back to a level less than recorded in 2014. This trend is consistent with the Voice of the Customer survey improvement in 2017 over 2016 results.
Total Operator Complaints by Category 2014-2017
| Complaints – Operator Performance | 2014 | 2015 | 2016 | 2017 | % Change |
| Speeding | 29 | 33 | 38 | 46 | 59% |
| Unsafe manner | 420 | 390 | 428 | 327 | -22% |
| Deadheaded | 44 | 13 | 28 | 20 | -55% |
| Idling | 5 | 0 | 8 | 8 | 60% |
| Drive through red light | 15 | 30 | 22 | 35 | 133% |
| Not stopping at stop sign | 43 | 11 | 9 | 7 | -84% |
| Yield to Bus | 6 | 51 | 53 | 45 | 650% |
| Quality of Ride | 96 | 36 | 54 | 66 | -31% |
| Splashed Pedestrian | 18 | 5 | 9 | 5 | -72% |
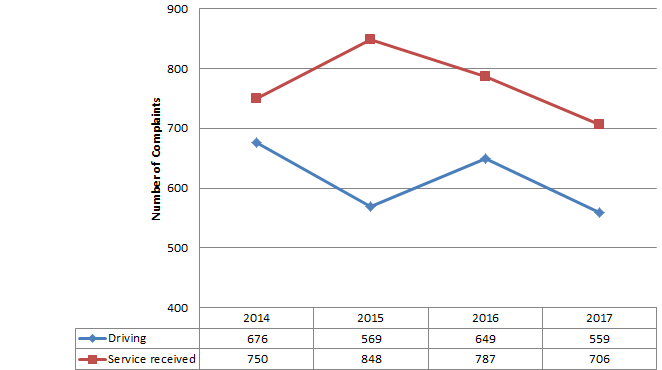
| Driving | 676 | 569 | 649 | 559 | -17% |
| Attitude/Treatment | 677 | 788 | 674 | 603 | -11% |
| Presentation | 4 | 0 | 15 | 7 | 75% |
| Smoking | 10 | 14 | 11 | 14 | 40% |
| Cell Phone | 44 | 40 | 28 | 44 | 0% |
| Missed stop requested | 15 | 6 | 59 | 38 | 153% |
| Service received | 750 | 848 | 787 | 706 | -6% |
| Total | 1,426 | 1,417 | 1,436 | 1,265 | -11% |
| Per 100,000 riders | 5.99 | 6.33 | 6.36 | 5.52 | -8% |
Driving related Operator complaints showed a decrease in 2017 to the lowest in the four year period. As the table indicates, driving complaints, which account for approximately 45% of the complaints regarding Operator performance decreased by 17% over the period. A continued focus in 2017 on defensive driver training, and management follow-up on driving complaints, specifically complaints related to unsafe behaviour, resulted in a reduction in these particular complaints compared to prior years, which correlates to a decrease in Motor Vehicle Accidents over the same period. In 2016, management began referring Operators with high numbers of driving-related complaints for accelerated defensive driving refresher training. The intent is to flag Operators that have the potential for a collision before one occurs. Complaints relating to driving are taken seriously, with particular attention paid to those categories which could result in a motor vehicle accident or injury to passengers (speeding, driving in unsafe manner, drive through red light, not stopping at stop sign). This program was continued in 2017, and the management team will continue to analyze complaint data and refer Operators trending high in these complaint categories for refresher training to support a proactive approach to reducing same.
Total complaints with respect to ‘service received from the Operator’ decreased by 6% over the period, to the lowest total in the four year horizon. The largest number of complaints in this category (representing approximately 78% of the total) relate to driver attitude and passenger treatment (good, poor etc.). In 2017, the driver attitude complaints decreased by 11% from 2014 levels, and also reached the lowest total for the four year period. Complaints are up in the remaining categories, however it should be noted that while the percentage increases appear to be significant, they are only high given the relatively small number of complaints in each of the categories.
In 2015, a comprehensive Advanced Customer Service Program was introduced, and as of the end of 2017, 71% of Operators had been trained in the new program. Priority for the advanced training was once again given to those employees who had recorded a high number of customer-service or behaviour-related complaints. The program was developed specifically to address current customer service trends, and provides additional guidance and support to Operators on how best to effectively manage issues such as schedule adherence and overcrowding, emphasizing appropriate driver behaviour, and re-iterating professional customer service expectations, with the goal to provide better service and ultimately reduce customer service complaints.
In the case of complaints alleging a significant Operator performance issue, an investigation is completed, which can include any or all of the following; interview with the Operator and complainant, assessment of AVLC data, review of the bus’ audio/visual system (noting there is a strict protocol for accessing the system recordings). It should be noted that contacts received from customers are based on the customer’s perception of the incident, and are not always consistent with what actually occurred. In all situations, when requested, a response regarding the assessment is provided to the customer who filed the contact.
Operator performance compliments are also tracked and trended, and while down very slightly in 2017 as compared to 2016, remain consistent with the four year average. The chart below sets out the trend in Operator compliments over the period of 2014 through 2017.
Total Operator Compliments by Category 2014-2017
| Compliments – Operator Performance | 2014 | 2015 | 2016 | 2017 | % Change |
| Attitude/Treatment | 212 | 341 | 272 | 267 | 26% |
| Presentation | 29 | 9 | 1 | 3 | -90% |
| Service received | 241 | 350 | 273 | 270 | 12% |
| Per 100,000 riders | 1.01 | 1.56 | 1.21 | 1.18 | 16% |
Impressions of Service Safety
As discussed in Staff Report #2, dated February 28, 2018, the Voice of the Customer survey questions were modified this year in an effort to gain a better understanding of feelings of safety with respect to waiting for and riding the bus.
The question relating to whether respondents felt that LTC vehicles were operated in a safe manner remained on the survey. As set out earlier in this report, 87% of respondents feel that LTC vehicles are operated in a safe manner, up from 80% in the previous survey. Customer sentiments are supported by the statistics relating to motor vehicle collisions and passenger falls.
Accident/incident reports in 2017 continued the downward trend experienced over the four year period. The tables below set out the total number of reports for each year for the period of 2014 through 2017.
Summary of Motor Vehicle Collisions – On Road 2014-2017
| Description | 2014 | 2015 | 2016 | 2017 |
| Number of reports | 368 | 329 | 302 | 291 |
| Preventable | 159 | 160 | 130 | 136 |
| Non-Preventable | 209 | 168 | 172 | 155 |
| Total per million km | 32.4 | 28.5 | 24.6 | 24.4 |
| Per 100,000 service hours | 64.4 | 56.6 | 50.1 | 47.4 |
| Mean km between reports | 30,851 | 34,971 | 40,514 | 42,046 |
| Year over year percent change | 13% | 16% | 4% |
Total motor vehicle accidents (MVAs) dropped slightly compared to 2016, while preventable MVAs climbed slightly compared to the previous year. The major categories for preventable MVAs continue to be striking fixed objects (lamp posts, parked cars, etc.) and sideswipes. As with customer contacts, the increases in service hours year over year need to be taken into account when assessing trends with motor vehicle accidents. When looking at the total motor vehicle accidents per million kilometers travelled and per 100,000 service hours, both have continued the trend downward, with 2017 representing the lowest rates in the four year period. While this trend is positive, it will only remain so with continued focus on causal analysis and implementation of programs to address underlying causes. An education campaign regarding safe driving practices relating to the most common accident types continues to run on LTC communication boards and has since the fall of 2016.
In 2017, accidents/incidents assessed as preventable represented approximately 47% of the reports filed showing a slight increase from the year prior. The determination of preventable vs. non-preventable is based upon the Ontario Safety League protocol.
Summary of Passenger Falls – 2014-2017
| Description | 2014 | 2015 | 2016 | 2017 |
| In motion | 48 | 24 | 46 | 28 |
| Stationary | 14 | 21 | 5 | 13 |
| Total | 62 | 45 | 51 | 41 |
| Per million km | 5.5 | 3.9 | 4.2 | 3.4 |
| Year over year percent change | -29% | 7% | -17% |
Passenger falls decreased slightly over 2016 (41 vs. 51), and remain below the four-year average on a per-million kilometer basis (3.4 vs. 4.2). The nature and extent of accidents/incidents are reflective of a number of factors including:
- changing and severity of weather conditions;
- increased road congestion and issues of road condition; and
- heightened service and customer service expectations.
All passenger fall reports are reviewed, including, as warranted, accessing audio/visual system recordings to investigate the event, all of which is shared with the Commission’s adjuster and legal counsel. The management of accidents/incidents is critical to providing passengers with a safe trip as well as mitigating risk and liability. In terms of cost and risk, the vast majority of the reported accidents/incidents are minor in nature reflecting in part the broad definition of what constitutes an accident/incident. The management program includes remedial training as appropriate, and the ongoing refresher defensive driving program which calls for each Operator to complete the program once every three years. As mentioned above, an increased focus on re-training those Operators with a high number of driving-related complaints appears to be paying dividends with a reduction in the number of MVAs over the past two years.
Access to LTC Information
Previous Voice of the Customer surveys included questions with respect to the type of information customers were looking for as well as the platform they would prefer to use. The feedback from these surveys was utilized in the re-design of the LTC website. On February 20, 2018 the new LTC website was launched, providing a more intuitive user experience. In addition, at the same time, a corporate Facebook and Twitter account were launched. It is anticipated that these changes will result in a much improved online user experience for anyone seeking information with respect to LTC.
The Voice of the Customer survey also asked respondents to rate their level of satisfaction with availability of information with respect to schedule adherence and service information, the results of which are set out below.
Voice of the Customer Perceptions – Availability of LTC Information
| Service Statement | 2016 | 2017 |
| It is easy to find out if buses are running on schedule | 57% | 66% |
| It is easy to get information about LTC services and schedules | 74% | 78% |
Customer satisfaction in both areas improved over the previous survey, however still remain low. The introduction of the new InfoWeb application as part of the new website launch is expected to address the access to information on real-time bus information. The new program is much more intuitive, and scalable to work on a variety of mobile devices. In addition, it provides a number of features that are customizable to the user, including the ability to receive emails specific to service interruptions at a route or stop level. The system also includes the ability to click on a specific bus on the map and check its status both in terms of schedule adherence and available capacity.
The other manner in which customers interface with LTC is via the customer service representatives, either via email or telephone. As set out in the following table, satisfaction levels with respect to customer service received by survey respondents was generally positive, but with room for improvement.
Voice of the Customer Perceptions – LTC Customer Service
| Service Statement | 2016 | 2017 |
| Customer service reps are helpful & courteous | 70% | 75% |
| My calls are answered promptly | 60% | 73% |
| My issues are addressed in a timely manner | 61% | 63% |
The following table sets out a summary (2014 to 2017 inclusive) relating to the provision of service information to customers via telephone, Interactive Voice Response system (IVR) and website.
Summary of Customer Access – LTC Information
| Description | 2014 | 2015 | 2016 | 2017 | Change ’14 vs. ’17 | % Change ’14 vs. ’17 |
| Calls/Visists (millions) | ||||||
| Information line – answered calls (1) | 0.088 | 0.075 | 0.079 | 0.074 | -0.014 | -15.9% |
| Interactive voice response (2) | 0.562 | 0.649 | 0.654 | 0.464 | -0.098 | -17.4% |
| Website – inlcuding web-watch (3) | 9.755 | 7.572 | 7.879 | 8.623 | -1.132 | -11.6% |
| 10.405 | 8.296 | 8.612 | 9.161 | -1.244 | -12.0% | |
| Total rides – conventional/specialized (millions) | 24.073 | 22.613 | 22.564 | 22.918 | -1.155 | -4.8% |
| Calls/visits per million rides | 0.432 | 0.367 | 0.382 | 0.400 | -0.032 | -7.5% |
| Percent change – year over year | -15.1% | 4.0% | 4.7% | |||
| Percent Make Up | ||||||
| Information line – answered calls | 0.8% | 0.9% | 0.9% | 0.8% | -0.04% | -4.5% |
| Interactive voice response | 5.4% | 7.8% | 7.6% | 5.1% | -0.34% | -6.2% |
| Website – inlcuding web-watch | 93.8% | 91.3% | 91.5% | 94.1% | 0.37% | 0.4% |
| 100% | 100% | 100% | 100% |
- Information Line statistics are for the hours of 8 a.m. – 10 p.m. Monday through Friday and 8:30 a.m. – 4:30 p.m. on weekends and statutory holidays. Service information provided by staff is based upon real-time information. Staff also assists with trip planning. The call answered rate (answered before terminated) averages 98% of calls offered.
- Interactive Voice Response (IVR) – IVR is a phone system that utilizes voice recognition technology to assist customers with providing real-time information by stop for conventional transit.
- The largest component of website access is WebWatch, which provides real-time service information by stop provided via LTC’s website. Customers are also able to access future day/trip stop information to assist with trip planning based upon scheduled information. The WebWatch counts include auto refreshes of the real-time information screen which can result in one customer’s lookup being recorded as multiple visits.
The use of IVR and the LTC website continue to represent the majority of customer inquiries to London Transit. Call volumes, despite showing a slight increase for 2016 have steadily decreased. The increase in calls to the call centre in 2016 is largely attributable to the significant service changes implemented where calls for trip planning and general information increased over prior years. Website traffic, which had been declining since 2014, increased again in 2017, the decline is largely due to the introduction of Google Maps (which allows customers to by-pass London Transit’s website to plan their trips). Increases are anticipated both with respect to website traffic as well as customer satisfaction given the launch of the new website and real-time information upgrades.
In addition to the above access points, the LTC currently provides approximately 500,000 printed route schedules (noting the schedules are also available for printing or downloading from LTC’s website), 50,000 printed ride guides, and employs 10 wayside signs each with eight lines of real-time service information. The signs are located at the four major regional malls, Western University, Fanshawe College and the downtown.
Going Forward
While the core business for LTC is the delivery of public transit, the underlying and perhaps more critical business is that of customer service. The 2017 Work Program included a number of key initiatives targeted to improve the customer experience both with respect to engagement with LTC and real-time access to information for riders including the corporate website upgrade, establishment of corporate social media accounts, upgrades to the Automatic Vehicle Location System including real-time information upgrades, and review of standard response times to customer contacts.
2018 will see the fine tuning of the aforementioned projects in response to customer feedback as well as a review of the Operations area in an effort to ensure that appropriate resources are being allocated to monitor and manage the service being delivered. The upgrade of the Automatic Vehicle Location System will provide access to data that will be critical in this effort.
Recommended by:
Tyson Cragg – Manager of Operations Administration
Patrick Cormier – Manager of Information Systems
Shawn Wilson – Director of Operations
Concurred in by:
Kelly S. Paleczny- General Manager